
Nomenclature
Short Name:
INSR
Full Name:
Insulin receptor
Alias:
- EC 2.7.10.1
- IR
- Kinase InsR
- CD220
- CD220 antigen
- HHF5
- Insulin receptor
Classification
Type:
Protein-tyrosine kinase
Group:
TK
Family:
InsR
SubFamily:
NA

Specific Links
Structure
Mol. Mass (Da):
156,319
# Amino Acids:
1382
# mRNA Isoforms:
2
mRNA Isoforms:
156,333 Da (1382 AA; P06213); 155,146 Da (1370 AA; P06213-2)
4D Structure:
Tetramer of 2 alpha and 2 beta chains linked by disulfide bonds. The alpha chains contribute to the formation of the ligand-binding domain, while the beta chains carry the kinase domain. Interacts with SORBS1 but dissociates from it following insulin stimulation. Binds SH2B2. Interacts with the PTB/PID domains of IRS1 and SHC1 in vitro when autophosphorylated on tyrosine residues. The sequences surrounding the phosphorylated NPXY motif contribute differentially to either IRS1 or SHC1 recognition. Interacts with the SH2 domains of the 85 kDa regulatory subunit of PI3K (PIK3R1) in vitro, when autophosphorylated on tyrosine residues. Interacts with SOCS7. Forms a hybrid receptor with IGF1R, the hybrid is a tetramer consisting of 1 alpha chain and 1 beta chain of INSR and 1 alpha chain and 1 beta chain of IGF1R. Interacts with CAV2 (tyrosine-phosphorylated form); the interaction is increased with Tyr-27 phosphorylation of CAV2. Interacts with ARRB2 By similarity. Interacts with GRB10; this interaction blocks the association between IRS1/IRS2 and INSR, significantly reduces insulin-stimulated tyrosine phosphorylation of IRS1 and IRS2 and thus decreases insulin signaling.
3D Structure:
1D Structure:
3D Image (rendered using PV Viewer):
PDB ID
Subfamily Alignment
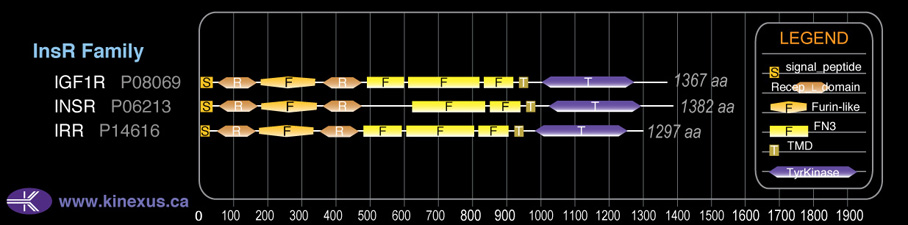
Domain Distribution:
| Start | End | Domain |
|---|---|---|
| 1 | 27 | signal_peptide |
| 52 | 164 | Recep_L_domain |
| 179 | 340 | Furin-like |
| 359 | 474 | Recep_L_domain |
| 622 | 695 | FN3 |
| 850 | 946 | FN3 |
| 957 | 979 | TMD |
| 1023 | 1290 | TyrKc |
| 1023 | 1298 | Pkinase |
Kinexus Products
Click on entries below for direct links to relevant products from Kinexus for this protein kinase.
hiddentext
Post-translation Modifications
For detailed information on phosphorylation of this kinase go to PhosphoNET
Acetylated:
K1112 (N6).
Methylated:
K1352.
N-GlcNAcylated:
N43, N52, N105, N138, N242, N282, N322, N364, N424, N445, N541, N633, N651,N698, N769, N782, N920, N933.
Serine phosphorylated:
S98, S366, S400, S407, S464, S717, S929, S1033, S1062, S1064, S1216+, S1217+, S1221+, S1314, S1332+, S1333+, S1348, S1354.
Threonine phosphorylated:
T361, T715, T731, T940, T1187, T1362, T1375+.
Tyrosine phosphorylated:
Y94, Y401, Y818, Y992-, Y999+, Y1011-, Y1038, Y1149, Y1185+, Y1189+, Y1190+, Y1355+, Y1356, Y1361+.
Ubiquitinated:
K1047, K1057, K1352.
Distribution
Based on gene microarray analysis from the NCBI
Human Tissue Distribution
% Max Expression:
Mean Expression:
Number of Samples:
Standard Deviation:
% Max Expression:
Mean Expression:
Number of Samples:
Standard Deviation:
 100
100
1289
53
1012
 16
16
205
21
315
 10
10
131
22
127
 25
25
320
206
875
 77
77
993
65
690
 7
7
86
110
131
 28
28
357
75
572
 26
26
336
65
523
 46
46
587
17
516
 43
43
559
209
780
 9
9
122
50
122
 49
49
636
236
702
 4
4
47
44
51
 14
14
185
15
313
 25
25
318
45
410
 16
16
211
36
168
 11
11
148
373
855
 11
11
146
33
189
 16
16
204
181
230
 63
63
816
221
694
 6
6
77
43
80
 15
15
193
46
234
 8
8
98
40
96
 4
4
54
33
53
 4
4
56
43
86
 79
79
1013
137
1068
 4
4
55
47
61
 10
10
125
33
117
 11
11
138
33
145
 10
10
130
84
92
 38
38
492
24
496
 27
27
354
56
427
 11
11
140
115
379
 65
65
838
166
739
 15
15
199
87
276
Evolution
Species Conservation
PhosphoNET % Identity:
PhosphoNET % Similarity:
Homologene %
Identity:
PhosphoNET % Identity:
PhosphoNET % Similarity:
Homologene %
Identity:
 100
100
100
100 22.1
22.1
36.3
100 -
-
-
99 -
-
-
97 -
-
-
98 93.6
93.6
95.6
95.5 -
-
-
- 94.5
94.5
96.7
96 94.6
94.6
97
96 -
-
-
- -
-
-
- 21.3
21.3
35.3
84 70.5
70.5
81.8
73.5 68.5
68.5
81
71 -
-
-
- 27.6
27.6
38.7
37 -
-
-
- 28.3
28.3
42.4
31 -
-
-
- -
-
-
- -
-
-
- -
-
-
- -
-
-
- -
-
-
- -
-
-
-
For a wider analysis go to PhosphoNET Evolution in PhosphoNET
Binding Proteins
Examples of known interacting proteins
hiddentext
| No. | Name – UniProt ID |
|---|---|
| 1 | PTPN1 - P18031 |
| 2 | IRS1 - P35568 |
| 3 | GRB10 - Q13322 |
| 4 | GRB14 - Q14449 |
| 5 | SHC1 - P29353 |
| 6 | PIK3R1 - P27986 |
| 7 | PTPN11 - Q06124 |
| 8 | IRS2 - Q9Y4H2 |
| 9 | SOCS1 - O15524 |
| 10 | CALM1 - P62158 |
| 11 | SOCS3 - O14543 |
| 12 | INS - P01308 |
| 13 | JAK2 - O60674 |
| 14 | PRKCD - Q05655 |
| 15 | SH2B1 - Q9NRF2 |
Regulation
Activation:
Phosphorylation of Ser-1001, Ser-1332, Ser-1333, Tyr-1355, Tyr-1361, Thr-1375 increases phosphotransferase activity. Phosphorylation of Tyr-999 increases phosphotransferase activity and induces interaction with SOCS3. Phosphorylation of Tyr-1185 increases phosphotransferase activity and induces interaction with IRS2 and PTP1B. Phosphorylation of Tyr-1189 and Tyr-1190 increases phosphotransferase activity and induces interaction with IRS2 and PTP1B.
Inhibition:
Phosphorylation of Tyr-992, Tyr-1011 inhibits phosphotransferase activity.
Synthesis:
NA
Degradation:
NA
Known Upstream Kinases
For further details on these substrates click on the Substrate Short Name or UniProt ID. Phosphosite Location is hyperlinked to PhosphoNET
predictions.
Based on in vitro and/or in vivo phosphorylation data
| Kinase Short Name | UniProt ID (Human) | Phosphosite Location | Phosphosite Sequence | Effect of Phosphorylation |
|---|
| INSR | P06213 | Y992 | DGPLGPLYASSNPEY | - |
| INSR | P06213 | Y999 | YASSNPEYLSASDVF | + |
| INSR | P06213 | Y1011 | DVFPCSVYVPDEWEV | - |
| TBK1 | Q9UHD2 | S1033 | LRELGQGSFGMVYEG | |
| PKCa | P17252 | S1062 | AVKTVNESASLRERI | |
| PKCa | P17252 | S1064 | KTVNESASLRERIEF | |
| INSR | P06213 | Y1185 | FGMTRDIYETDYYRK | + |
| INSR | P06213 | Y1189 | RDIYETDYYRKGGKG | + |
| INSR | P06213 | Y1190 | DIYETDYYRKGGKGL | + |
| INSR | P06213 | S1314 | EENKAPESEELEMEF | |
| INSR | P06213 | S1348 | GGRDGGSSLGFKRSY | |
| INSR | P06213 | Y1355 | SLGFKRSYEEHIPYT | + |
| INSR | P06213 | Y1356 | SLSIKRTYDEHIPYT | |
| INSR | P06213 | Y1361 | SYEEHIPYTHMNGGK | + |
| PKCa | P17252 | T1375 | KKNGRILTLPRSNPS | + |
Known Downstream Substrates
For further details on these substrates click on the Substrate Short Name or UniProt ID. Phosphosite Location is hyperlinked to PhosphoNET
predictions.
Based on in vitro and/or in vivo phosphorylation data
| Substrate Short Name | UniProt ID (Human) | Phosphosite Location | Phosphosite Sequence | Effect of Phosphorylation |
|---|
| ADRB2 | P07550 | Y132 | CVIAVDRYFAITSPF | |
| ADRB2 | P07550 | Y141 | AITSPFKYQSLLTKN | |
| ADRB2 | P07550 | Y350 | RRSSLKAYGNGYSSN | |
| ADRB2 | P07550 | Y354 | LKAYGNGYSSNGNTG | |
| ANXA1 | P04083 | Y20 | IENEEQEYVQTVKSS | |
| APS | O14492 | Y629 | ARAVENQYSFY____ | |
| ARHGAP5 | Q13017 | Y306 | NHPDYEEYINLEGTR | |
| BLVRA (BVA) | P53004 | Y198 | EERKEDQYMKMTVCL | + |
| BLVRA (BVA) | P53004 | Y228 | PGLKRNRYLSFHFKS | |
| BLVRA (BVA) | P53004 | Y291 | LAEEIQKYCCSRK__ | |
| Calmodulin | P62158 | Y139 | DGDGQVNYEEFVQMM | |
| Calmodulin | P62158 | Y99 | FDKDGNGYISAAELR | |
| Caveolin 1 (CAV1) | Q03135 | Y14 | VDSEGHLYTVPIREQ | |
| Cbl | P22681 | Y371 | TQEQYELYCEMGSTF | |
| Cbl | P22681 | Y700 | EGEEDTEYMTPSSRP | |
| Cbl | P22681 | Y774 | SENEDDGYDVPKPPV | |
| CEACAM1 | P13688 | S508 | QQPTQPTSASPSLTA | |
| CEACAM1 | P13688 | Y493 | NKMNEVTYSTLNFEA | |
| CEACAM1 | P13688 | Y520 | LTATEIIYSEVKKQ_ | |
| Dok1 p62 | Q99704 | Y362 | DPKEDPIYDEPEGLA | + |
| Dok1 p62 | Q99704 | Y398 | ARVKEEGYELPYNPA | + |
| FABP4 | P15090 | Y19 | SSENFDDYMKEVGVG | |
| GAB1 | Q13480 | Y242 | FFQQQMIYDSPPSRA | |
| GAB1 | Q13480 | Y285 | TEADGELYVFNTPSG | |
| GAB1 | Q13480 | Y373 | ASDTDSSYCIPTAGM | |
| GAB1 | Q13480 | Y447 | SEELDENYVPMNPNS | |
| GAB1 | Q13480 | Y472 | EPIQEANYVPMTPGT | |
| GAB1 | Q13480 | Y589 | SHDSEENYVPMNPNL | |
| GAB1 | Q13480 | Y627 | KGDKQVEYLDLDLDS | |
| GAB1 | Q13480 | Y659 | VADERVDYVVVDQQK | |
| IkBa | P25963 | Y42 | DSMKDEEYEQMVKEL | - |
| InsR | P06213 | S1314 | EENKAPESEELEMEF | |
| InsR | P06213 | S1348 | GGRDGGSSLGFKRSY | |
| InsR | P06213 | Y1011 | DVFPCSVYVPDEWEV | - |
| InsR | P06213 | Y1185 | FGMTRDIYETDYYRK | + |
| InsR | P06213 | Y1189 | RDIYETDYYRKGGKG | + |
| InsR | P06213 | Y1190 | DIYETDYYRKGGKGL | + |
| InsR | P06213 | Y1355 | SLGFKRSYEEHIPYT | + |
| InsR | P06213 | Y1356 | SLSIKRTYDEHIPYT | |
| InsR | P06213 | Y1361 | SYEEHIPYTHMNGGK | + |
| InsR | P06213 | Y992 | DGPLGPLYASSNPEY | - |
| InsR | P06213 | Y999 | YASSNPEYLSASDVF | + |
| IRS1 | P35568 | S1222 | ESSSTRRSSEDLSAY | |
| IRS1 | P35568 | Y1179 | GLENGLNYIDLDLVK | |
| IRS1 | P35568 | Y1222 | SSEDLSTYASINFQK | |
| IRS1 | P35568 | Y1229 | SSEDLSAYASISFQK | |
| IRS1 | P35568 | Y465 | GEEELSNYICMGGKG | |
| IRS1 | P35568 | Y612 | TLHTDDGYMPMSPGV | |
| IRS1 | P35568 | Y632 | GRKGSGDYMPMSPKS | |
| IRS1 | P35568 | Y896 | EPKSPGEYVNIEFGS | ? |
| IRS1 | P35568 | Y941 | EETGTEEYMKMDLGP | |
| IRS1 | P35568 | Y989 | VPSSRGDYMTMQMSC | |
| IRS2 | Q9Y4H2 | Y628 | PKVAYHPYPEDYGDI | - |
| IRS2 | Q9Y4H2 | Y632 | YHPYPEDYGDIEIGS | |
| PIK3R1 | P27986 | Y368 | STKMHGDYTLTLRKG | |
| PIK3R1 | P27986 | Y580 | LRKTRDQYLMWLTQK | |
| PIK3R1 | P27986 | Y607 | NENTEDQYSLVEDDE | |
| PIK3R3 | Q92569 | Y341 | NEDADENYFINEEDE | |
| PPP2CA | P67775 | Y307 | VTRRTPDYFL_____ | + |
| PTPN6 (SHP1) | P29350 | Y536 | QKGQESEYGNITYPP | + |
| SOCS3 | O14543 | Y204 | VNGHLDSYEKVTQLP | |
| STAT5B | P51692 | Y699 | TAKAVDGYVKPQIKQ | + |
Protein Kinase Specificity
Matrix of observed frequency (%) of amino acids in aligned protein substrate phosphosites
Matrix Type:
Experimentally derived from alignment of 79 known protein substrate phosphosites and 31 peptides phosphorylated by recombinant INSR in vitro tested in-house by Kinexus.
Domain #:
1
Inhibitors
For further details on these inhibitors click on the Compound Name and enter it into DrugKiNET or click on the ID's
Based on in vitro and/or in vivo phosphorylation data
| Compound Name | KD, Ki or IC50 (nM) | PubChem ID | ChEMBL ID | PubMed ID |
|---|
Disease Linkage
General Disease Association:
Cancer, endocrine disorders
Specific Diseases (Non-cancerous):
Hyperinsulinemic hypoglycemia, familial, 5; Diabetes mellitus, Insulin-resistant, with acanthosis nigricans; Rabson-Mendenhall syndrome; Donohue syndrome; Diabetes mellitus, non-insulin-dependent, late onset; Hypertension, Insulin resistance-related; Alzheimer's disease; Myotonic dystrophy; Ovarian disease; Acanthosis nigricans; Hyperinsulinemic hypoglycemia; Obesity; Metabolic syndrome X; Hemi-hypertrophy; Congenital fiber-type disproportion; Myotonic dystrophy Type 2; Berardinelli-Seip congenital lipodystrophy; Acanthocytosis; Fetal macrosomia; Fasting hypoglycemia; Insulin autoimmune syndrome
Comments:
Hyperinsulinemic hypoglycemia is a condition characterized by low blood glucose resulting from the excessive release of insulin. This disease can be acquired during life or inherited and can range in severity from life-threatenting to a mild nuissance. Diabetes mellitus, insulin resistance with acanthosis nigricans is a disease characterized by combined symptoms of diabetes, insulin resistance, and acanthosis nigricans. Acanthosis nigricans is characterized by the hyperpigmentation of the skin, producing a brown to black, poorly defined, and velvety region of skin, which is usually found in the posterior and lateral folds of the neck, the armpits, navel, forehead, groin, and other body folds. Donohue syndrome, also known as Leprechanumism, is an extremely rare genetic disease characterized by stunted growth, protruding ears, flaring nostrils, and thick lips. Rabson-Mendenhall syndrome is a genetic disease characterized by a severe resistance to insulin. Symptoms of the disease include growth retardation, hypertrophy of muscle and fat tissues, and craniofacial, dental, and skin abnormalities. Several mutations in the INSR gene have been observed in patients with diabetes mellitus, insulin resistance, with acanthosis nigricans, including substitution mutations (G1035V, R762S, W1227S, A1161T, N489S, R1020Q, A1162E, R1201Q) and nonsense mutations (W160X). These mutations are associated with a loss-of-function , as many of them are found within the kinase catalytic domain of the protein. It was observed that a patient with Donohue syndrome displayed an 80-90% reduction in the amount of INSR in circulating monocytes, and those present had a significantly decreased responsiveness to temperature and pH. In addition, a marked reduction in INSR mRNA has also been demonstrated in the circulating monocytes of a patient with Donohue syndrome. Several mutations in the INSR gene have been observed in patients with Donohue syndrome, including substitution mutations (K487E, L260P, H236R, G58R, V55A, G393R, R113P, W439S, I146M, N458D) and nonsense mutations (Q699X, R924X, R399X, K148X). These mutations are also associated with a loss-of-function of the protein. In addition, two mutations in the INSR gene were observed in patients with Rabson-Medenhall syndrome. One was a A-G transition at the 3-prime splice site of intron 4 resulting in a decreased mRNA expression and a severely truncated protein. The other mutation was an 8-bp deletion in exon 12 of the gene. This mutation also decreased mRNA levels and produced a truncated protein. Thus, the phenotype of this disease is associated with a defective INSR protein. Several animal studies have revealed links between INSR and disease phenotypes. For example, genetically obese mice with insulin resistance were shown to have a mutation in the INSR gene, which decreased the tyrosine kinase catalytic activity of the protein. In addition, ablation of all INSR in mice resulted in the development of severe hyperglycemia and hyperketonia within hours of birth, resulting in death due to diabetic ketoacidosis within 48-72 hours of birth.
Specific Cancer Types:
Brain cancer
Comments:
INSR appears to be an oncoprotein (OP). over activation of the insulin receptor signalling pathway has been linked to the development of several cancer types. Significantly elevated INSR expression is observed in a high percentage of samples representing several subtypes of breast cancer (e. g. luminal; 48. 1%, triple negative; 41. 9%, and HER2; 64. 3%, of 438 specimens). In addition, elevated INSR expression in breast cancer is correlated with poor patient survival. Expression of phosphorylated INSR, as well as phosphoryalted IGF-1R and its downstream signalling target phospho-S6, were observed in 438 cases of invasive breast cancer samples. In eight breast cancer cell lines it was demonstrated that IGF-2 binds to and activates the INSR protein with 63% of the potency of insulin. By contrast, in non-malignant human breast cells, IGF-2 has about 1% the potency of insulin in binding to INSR. This activation of INSR by IGF-2 in cancer cells at much higher potency than in normal cells is hypothesized to lead to cancer cell growth and represent a novel autocrine/paracrine signalling mechanism by which cancer cells can promote survival and proliferation. Additionally, elevated INSR expression has been reported in breast cancer cell lines, higher than in any normal tissue investigated, including the liver. The INSR protein in the cancer cell retained the ability to bind to and be activated by insulin. INSR expression in the cancer specimens was restricted to the epithelial cells of the breast and was not obsrved in either the stromal or inflammatory cells present in the tissue samples. Additionally, there was no correlation between INSR expression level, age, body weight, menopausal status, or nodal involvement.
Gene Expression in Cancers:
TranscriptoNET (www.transcriptonet.ca) analysis with mRNA expression data retrieved from the National Center for Biotechnology Information's Gene Expression Omnibus (GEO) database, which was normalized against 60 abundantly and commonly found proteins, indicated altered expression for this protein kinase as shown here as the percent change from normal tissue controls (%CFC) as supported with the Student T-test in the following types of human cancers: Barrett's esophagus epithelial metaplasia (%CFC= +285, p<0.017); Breast epithelial hyperplastic enlarged lobular units (HELU) (%CFC= -59, p<0.011); Clear cell renal cell carcinomas (cRCC) stage I (%CFC= +281, p<0.007); Oral squamous cell carcinomas (OSCC) (%CFC= +70, p<0.082); Pituitary adenomas (aldosterone-secreting) (%CFC= +61, p<0.017); and Prostate cancer - primary (%CFC= +72, p<0.0001). The COSMIC website notes an up-regulated expression score for INSR in diverse human cancers of 348, which is 0.8-fold of the average score of 462 for the human protein kinases. The down-regulated expression score of 23 for this protein kinase in human cancers was 0.4-fold of the average score of 60 for the human protein kinases.
Mutagenesis Experiments:
Insertional mutagenesis studies in mice have not yet revealed a role for this protein kinase in mouse cancer oncogenesis.
Mutation Rate in All Cancers:
Percent mutation rates per 100 amino acids length in human cancers: 0.07 % in 25404 diverse cancer specimens. This rate is only -5 % lower and is very similar to the average rate of 0.075 % calculated for human protein kinases in general.
Mutation Rate in Specific Cancers:
Highest percent mutation rates per 100 amino acids length in human cancers: 0.35 % in 864 skin cancers tested; 0.31 % in 1270 large intestine cancers tested; 0.24 % in 603 endometrium cancers tested; 0.21 % in 589 stomach cancers tested; 0.12 % in 710 oesophagus cancers tested; 0.12 % in 548 urinary tract cancers tested; 0.12 % in 238 bone cancers tested; 0.11 % in 1958 lung cancers tested; 0.08 % in 273 cervix cancers tested; 0.06 % in 891 ovary cancers tested; 0.06 % in 1512 liver cancers tested; 0.06 % in 1316 breast cancers tested; 0.06 % in 127 biliary tract cancers tested; 0.04 % in 1276 kidney cancers tested; 0.02 % in 942 upper aerodigestive tract cancers tested; 0.02 % in 939 prostate cancers tested; 0.02 % in 441 autonomic ganglia cancers tested; 0.02 % in 2082 central nervous system cancers tested; 0.02 % in 1467 pancreas cancers tested; 0.01 % in 558 thyroid cancers tested; 0 % in 2009 haematopoietic and lymphoid cancers tested.
Frequency of Mutated Sites:
Most frequent mutations with the number of reports indicated in brackets: A1340V (3).
Comments:
Only 2 deletions, and no insertions or complex mutations are noted on the COSMIC website.