
Nomenclature
Short Name:
FES
Full Name:
Proto-oncogene tyrosine-protein kinase Fes-Fps
Alias:
- C-FES
- Kinase Fes
- Oncogene FES, feline sarcoma virus
- C-fes/fps protein
- EC 2.7.10.2
- Feline sarcoma oncogene
- FES/FPS
- FPS
Classification
Type:
Protein-tyrosine kinase
Group:
TK
Family:
Fer
SubFamily:
NA

Specific Links
Structure
Mol. Mass (Da):
93,497
# Amino Acids:
822
# mRNA Isoforms:
1
mRNA Isoforms:
33,248 Da (306 AA; P07333-2)
4D Structure:
NA
1D Structure:
3D Image (rendered using PV Viewer):
PDB ID
Subfamily Alignment
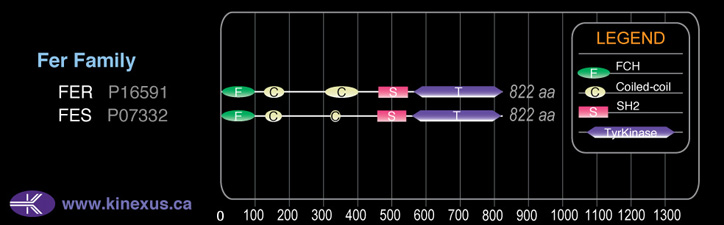
Domain Distribution:
| Start | End | Domain |
|---|---|---|
| 1 | 69 | FCH |
| 128 | 169 | Coiled-coil |
| 324 | 343 | Coiled-coil |
| 460 | 549 | SH2 |
| 561 | 814 | TyrKc |
| 561 | 816 | Pkinase |
Kinexus Products
Click on entries below for direct links to relevant products from Kinexus for this protein kinase.
hiddentext
Post-translation Modifications
For detailed information on phosphorylation of this kinase go to PhosphoNET
Serine phosphorylated:
S64, S67, S100, S373, S408, S410, S411, S412, S477, S716+.
Threonine phosphorylated:
T409, T421, T423, T595.
Tyrosine phosphorylated:
Y156, Y261, Y614, Y713+, Y734, Y811.
Ubiquitinated:
K725.
Distribution
Based on gene microarray analysis from the NCBI
Human Tissue Distribution
% Max Expression:
Mean Expression:
Number of Samples:
Standard Deviation:
% Max Expression:
Mean Expression:
Number of Samples:
Standard Deviation:
 100
100
821
16
1130
 2
2
14
8
10
 35
35
289
17
674
 29
29
240
61
447
 66
66
541
11
424
 1.3
1.3
11
37
11
 39
39
324
19
626
 39
39
322
36
493
 29
29
235
10
237
 8
8
66
42
109
 10
10
82
30
102
 56
56
456
123
498
 11
11
93
30
154
 2
2
17
8
14
 22
22
180
27
454
 2
2
14
7
16
 7
7
61
114
97
 95
95
777
26
3034
 5
5
37
61
54
 40
40
331
56
383
 11
11
87
27
124
 28
28
228
30
216
 23
23
186
28
190
 10
10
80
24
151
 13
13
108
26
182
 68
68
562
42
1050
 18
18
149
33
614
 42
42
346
24
1163
 12
12
102
26
146
 5
5
43
14
24
 65
65
532
18
396
 77
77
635
21
689
 13
13
106
54
552
 86
86
704
31
664
 10
10
79
22
54
Evolution
Species Conservation
PhosphoNET % Identity:
PhosphoNET % Similarity:
Homologene %
Identity:
PhosphoNET % Identity:
PhosphoNET % Similarity:
Homologene %
Identity:
 100
100
100
100 99.8
99.8
100
100 97.5
97.5
98.1
98 -
-
-
93 -
-
-
94 94
94
97.1
94 -
-
-
- 90.6
90.6
95.2
91 26.2
26.2
32.5
91.5 -
-
-
- 51.9
51.9
69.8
- 24.7
24.7
41.7
70 64.5
64.5
80.7
66 50.2
50.2
66.7
58 -
-
-
- 27.6
27.6
41.2
- -
-
-
- -
-
-
38 -
-
-
- -
-
-
- -
-
-
- -
-
-
- -
-
-
34 -
-
-
- -
-
-
-
For a wider analysis go to PhosphoNET Evolution in PhosphoNET
Binding Proteins
Examples of known interacting proteins
hiddentext
| No. | Name – UniProt ID |
|---|---|
| 1 | BCR - P11274 |
| 2 | PIK3R1 - P27986 |
| 3 | HSH2D - Q96JZ2 |
| 4 | STAT3 - P40763 |
| 5 | IL4R - P24394 |
| 6 | PLXNA1 - Q9UIW2 |
| 7 | BCAR1 - P56945 |
| 8 | CSF2RB - P32927 |
| 9 | IRS1 - P35568 |
| 10 | HSPA4 - P34932 |
| 11 | PPID - Q08752 |
| 12 | FKBP4 - Q02790 |
| 13 | PTGES3 - Q15185 |
| 14 | DOK1 - Q99704 |
| 15 | EGFR - P00533 |
Regulation
Activation:
Phosphorylation of Tyr-713 increases phosphotransferase activity and interaction with Fes.
Inhibition:
NA
Synthesis:
NA
Degradation:
NA
Known Upstream Kinases
For further details on these substrates click on the Substrate Short Name or UniProt ID. Phosphosite Location is hyperlinked to PhosphoNET
predictions.
Based on in vitro and/or in vivo phosphorylation data
| Kinase Short Name | UniProt ID (Human) | Phosphosite Location | Phosphosite Sequence | Effect of Phosphorylation |
|---|
Known Downstream Substrates
For further details on these substrates click on the Substrate Short Name or UniProt ID. Phosphosite Location is hyperlinked to PhosphoNET
predictions.
Based on in vitro and/or in vivo phosphorylation data
| Substrate Short Name | UniProt ID (Human) | Phosphosite Location | Phosphosite Sequence | Effect of Phosphorylation |
|---|
| Bcr | P11274 | Y177 | ADAEKPFYVNVEFHH | + |
| Bcr | P11274 | Y246 | SCGVDGDYEDAELNP | + |
| Bcr | P11274 | Y283 | YQPYQSIYVGGMMEG | |
| Fes | P07332 | Y156 | SAQAKRKYQEASKDK | |
| Fes | P07332 | Y713 | REEADGVYAASGGLR | + |
| Fes | P07332 | Y811 | RPSFSTIYQELQSIR | |
| HS1(HCLS1) | P14317 | Y378 | EPEPENDYEDVEEMD | |
| HS1(HCLS1) | P14317 | Y397 | EDEPEGDYEEVLEPE | + |
| NSF | P46459 | Y83 | QEIEVSLYTFDKAKQ | |
| PECAM-1 | P16284 | Y713 | KKDTETVYSEVRKAV | |
| PECAM-1 | P16284 | Y728 | PDAVESRYSRTEGSL |
Protein Kinase Specificity
Matrix of observed frequency (%) of amino acids in aligned protein substrate phosphosites
Matrix Type:
Experimentally derived from alignment of 11 known protein substrate phosphosites and 45 peptides phosphorylated by recombinant Fes in vitro tested in-house by Kinexus.
Domain #:
1
Inhibitors
For further details on these inhibitors click on the Compound Name and enter it into DrugKiNET or click on the ID's
Based on in vitro and/or in vivo phosphorylation data
| Compound Name | KD, Ki or IC50 (nM) | PubChem ID | ChEMBL ID | PubMed ID |
|---|
Disease Linkage
General Disease Association:
Cancer
Specific Cancer Types:
Sarcomas; Acute promyelocytic leukemias (APL)
Comments:
Fes has been demonstrated to be an oncoprotein in several human cancer types, potentially due to abnormal activation of the kinase catalytic function. It was originally identified as an oncoprotein from avian retroviral (Fps in Fujinami sarcoma virus) and cat retroviral (Fes in feline sarcoma virus) studies. Interestingly, Fes has also been shown to act as a tumor-suppressor protein in some human cancer types. For example, reduced or absent expression of the Fes protein is observed in colon cancer specimens and the ectopic expression of Fes in colon cancer cell lines results in the suppression of anchorage-independent cell growth, indicating a tumour suppressing role for the Fes protein. In contrast, Fes expression is significantly elevated in prostate cancer specimens and is thought to actively promote cell growth in renal carcinoma cell lines. The Fes gene has been mapped to the long arm of chromosome 15. This chromosomal region has been implicated as a causal factor of acute promyelocytic leukemia, as leukemogenesis of this cancer type is associated with a translocation between chromosome 15 and 17. This translocation has been confirmed in human patients with acute promyelocytic leukemia in which the Fes gene was found to be located on chromosome 17, instead of chromosome 15. In animal studies, mice lacking Fes expression displayed deficits in hematopoiesis and had significantly reduced numbers of circulating mature myeloid cells and immature myeloid precursors, indicating a oncogenic role for the Fes protein in this cancer. In addition, as a result it was also suggested that the Fes protein may have a role in regulating the innate immune response.
Gene Expression in Cancers:
The COSMIC website notes an up-regulated expression score for FES in diverse human cancers of 374, which is 0.8-fold of the average score of 462 for the human protein kinases. The down-regulated expression score of 38 for this protein kinase in human cancers was 0.6-fold of the average score of 60 for the human protein kinases.
Mutagenesis Experiments:
Insertional mutagenesis studies in mice have not yet revealed a role for this protein kinase in mouse cancer oncogenesis.
Mutation Rate in All Cancers:
Percent mutation rates per 100 amino acids length in human cancers: 0.07 % in 25042 diverse cancer specimens. This rate is only -9 % lower and is very similar to the average rate of 0.075 % calculated for human protein kinases in general.
Mutation Rate in Specific Cancers:
Highest percent mutation rates per 100 amino acids length in human cancers: 0.33 % in 805 skin cancers tested; 0.31 % in 830 upper aerodigestive tract cancers tested; 0.29 % in 589 stomach cancers tested; 0.26 % in 1093 large intestine cancers tested; 0.16 % in 846 ovary cancers tested.
Frequency of Mutated Sites:
Most frequent mutations with the number of reports indicated in brackets: E651G (20).
Comments:
Only 1 deletion and no complex mutations, but 18 insertions at A653fs*50 located in the kinase catalytic domain, are noted on the COSMIC website.