Nomenclature
Short Name:
TEC
Full Name:
Tyrosine-protein kinase Tec
Alias:
- EC 2.7.10.2
- Kinase Tec
- MGC126760
- MGC126762
- PSCTK4
Classification
Type:
Protein-tyrosine kinase
Group:
TK
Family:
Tec
SubFamily:
NA
Specific Links
Structure
Mol. Mass (Da):
73581
# Amino Acids:
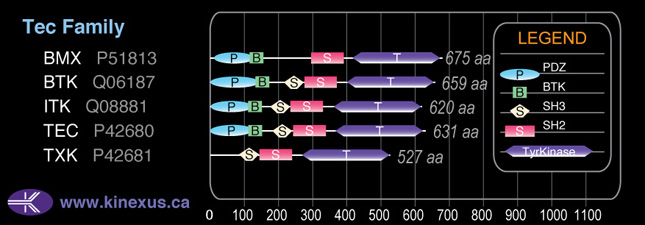
631
# mRNA Isoforms:
1
mRNA Isoforms:
73,581 Da (631 AA; P42680)
4D Structure:
Interacts with INPP5D/SHIP1 and INPPL1/SHIP2
1D Structure:
Subfamily Alignment

Domain Distribution:
Kinexus Products
Click on entries below for direct links to relevant products from Kinexus for this protein kinase.
hiddentext
Post-translation Modifications
For detailed information on phosphorylation of this kinase go to PhosphoNET
Serine phosphorylated:
S129, S378.
Threonine phosphorylated:
T88, T520.
Tyrosine phosphorylated:
Y90, Y120, Y130, Y188, Y206, Y223, Y228, Y233, Y281, Y286, Y343, Y360, Y519+.
Ubiquitinated:
K51, K155.
Distribution
Based on gene microarray analysis from the NCBI
Human Tissue Distribution
% Max Expression:
Mean Expression:
Number of Samples:
Standard Deviation:
% Max Expression:
Mean Expression:
Number of Samples:
Standard Deviation:
 29
29
231
16
374
 1.1
1.1
9
10
7
 38
38
308
17
266
 71
71
572
60
1456
 37
37
301
11
232
 4
4
30
41
102
 35
35
287
19
563
 45
45
362
35
496
 22
22
176
10
173
 13
13
106
59
160
 27
27
219
28
269
 67
67
543
100
592
 38
38
306
28
508
 1.1
1.1
9
9
9
 17
17
141
26
233
 0.9
0.9
7
8
10
 10
10
80
116
251
 44
44
358
23
339
 7
7
60
59
127
 31
31
251
56
330
 13
13
107
26
154
 24
24
197
28
326
 24
24
193
26
176
 20
20
164
24
176
 32
32
258
26
271
 45
45
364
44
477
 22
22
180
31
239
 21
21
174
24
256
 23
23
186
24
220
 4
4
32
14
9
 56
56
454
18
327
 100
100
810
21
1729
 21
21
170
45
409
 80
80
645
31
663
 5
5
43
22
65
Evolution
Species Conservation
PhosphoNET % Identity:
PhosphoNET % Similarity:
Homologene %
Identity:
PhosphoNET % Identity:
PhosphoNET % Similarity:
Homologene %
Identity:
 100
100
100
100 99.8
99.8
99.8
100 99.7
99.7
99.7
100 -
-
-
96 -
-
-
- 96.2
96.2
97.9
96 -
-
-
- 94.1
94.1
97.2
95 32.3
32.3
50.1
95 -
-
-
- 78.8
78.8
85.9
- 54.8
54.8
71.1
83 33.6
33.6
49.3
77 65.6
65.6
79.4
69 -
-
-
- 39.7
39.7
55
51 -
-
-
- -
-
-
- -
-
-
- -
-
-
- -
-
-
- -
-
-
- -
-
-
- -
-
-
- -
-
-
-
For a wider analysis go to PhosphoNET Evolution in PhosphoNET
Regulation
Activation:
NA
Inhibition:
NA
Synthesis:
NA
Degradation:
NA
Known Upstream Kinases
For further details on these substrates click on the Substrate Short Name or UniProt ID. Phosphosite Location is hyperlinked to PhosphoNET
predictions.
Based on in vitro and/or in vivo phosphorylation data
| Kinase Short Name | UniProt ID (Human) | Phosphosite Location | Phosphosite Sequence | Effect of Phosphorylation |
|---|
Known Downstream Substrates
For further details on these substrates click on the Substrate Short Name or UniProt ID. Phosphosite Location is hyperlinked to PhosphoNET
predictions.
Based on in vitro and/or in vivo phosphorylation data
| Substrate Short Name | UniProt ID (Human) | Phosphosite Location | Phosphosite Sequence | Effect of Phosphorylation |
|---|
Protein Kinase Specificity
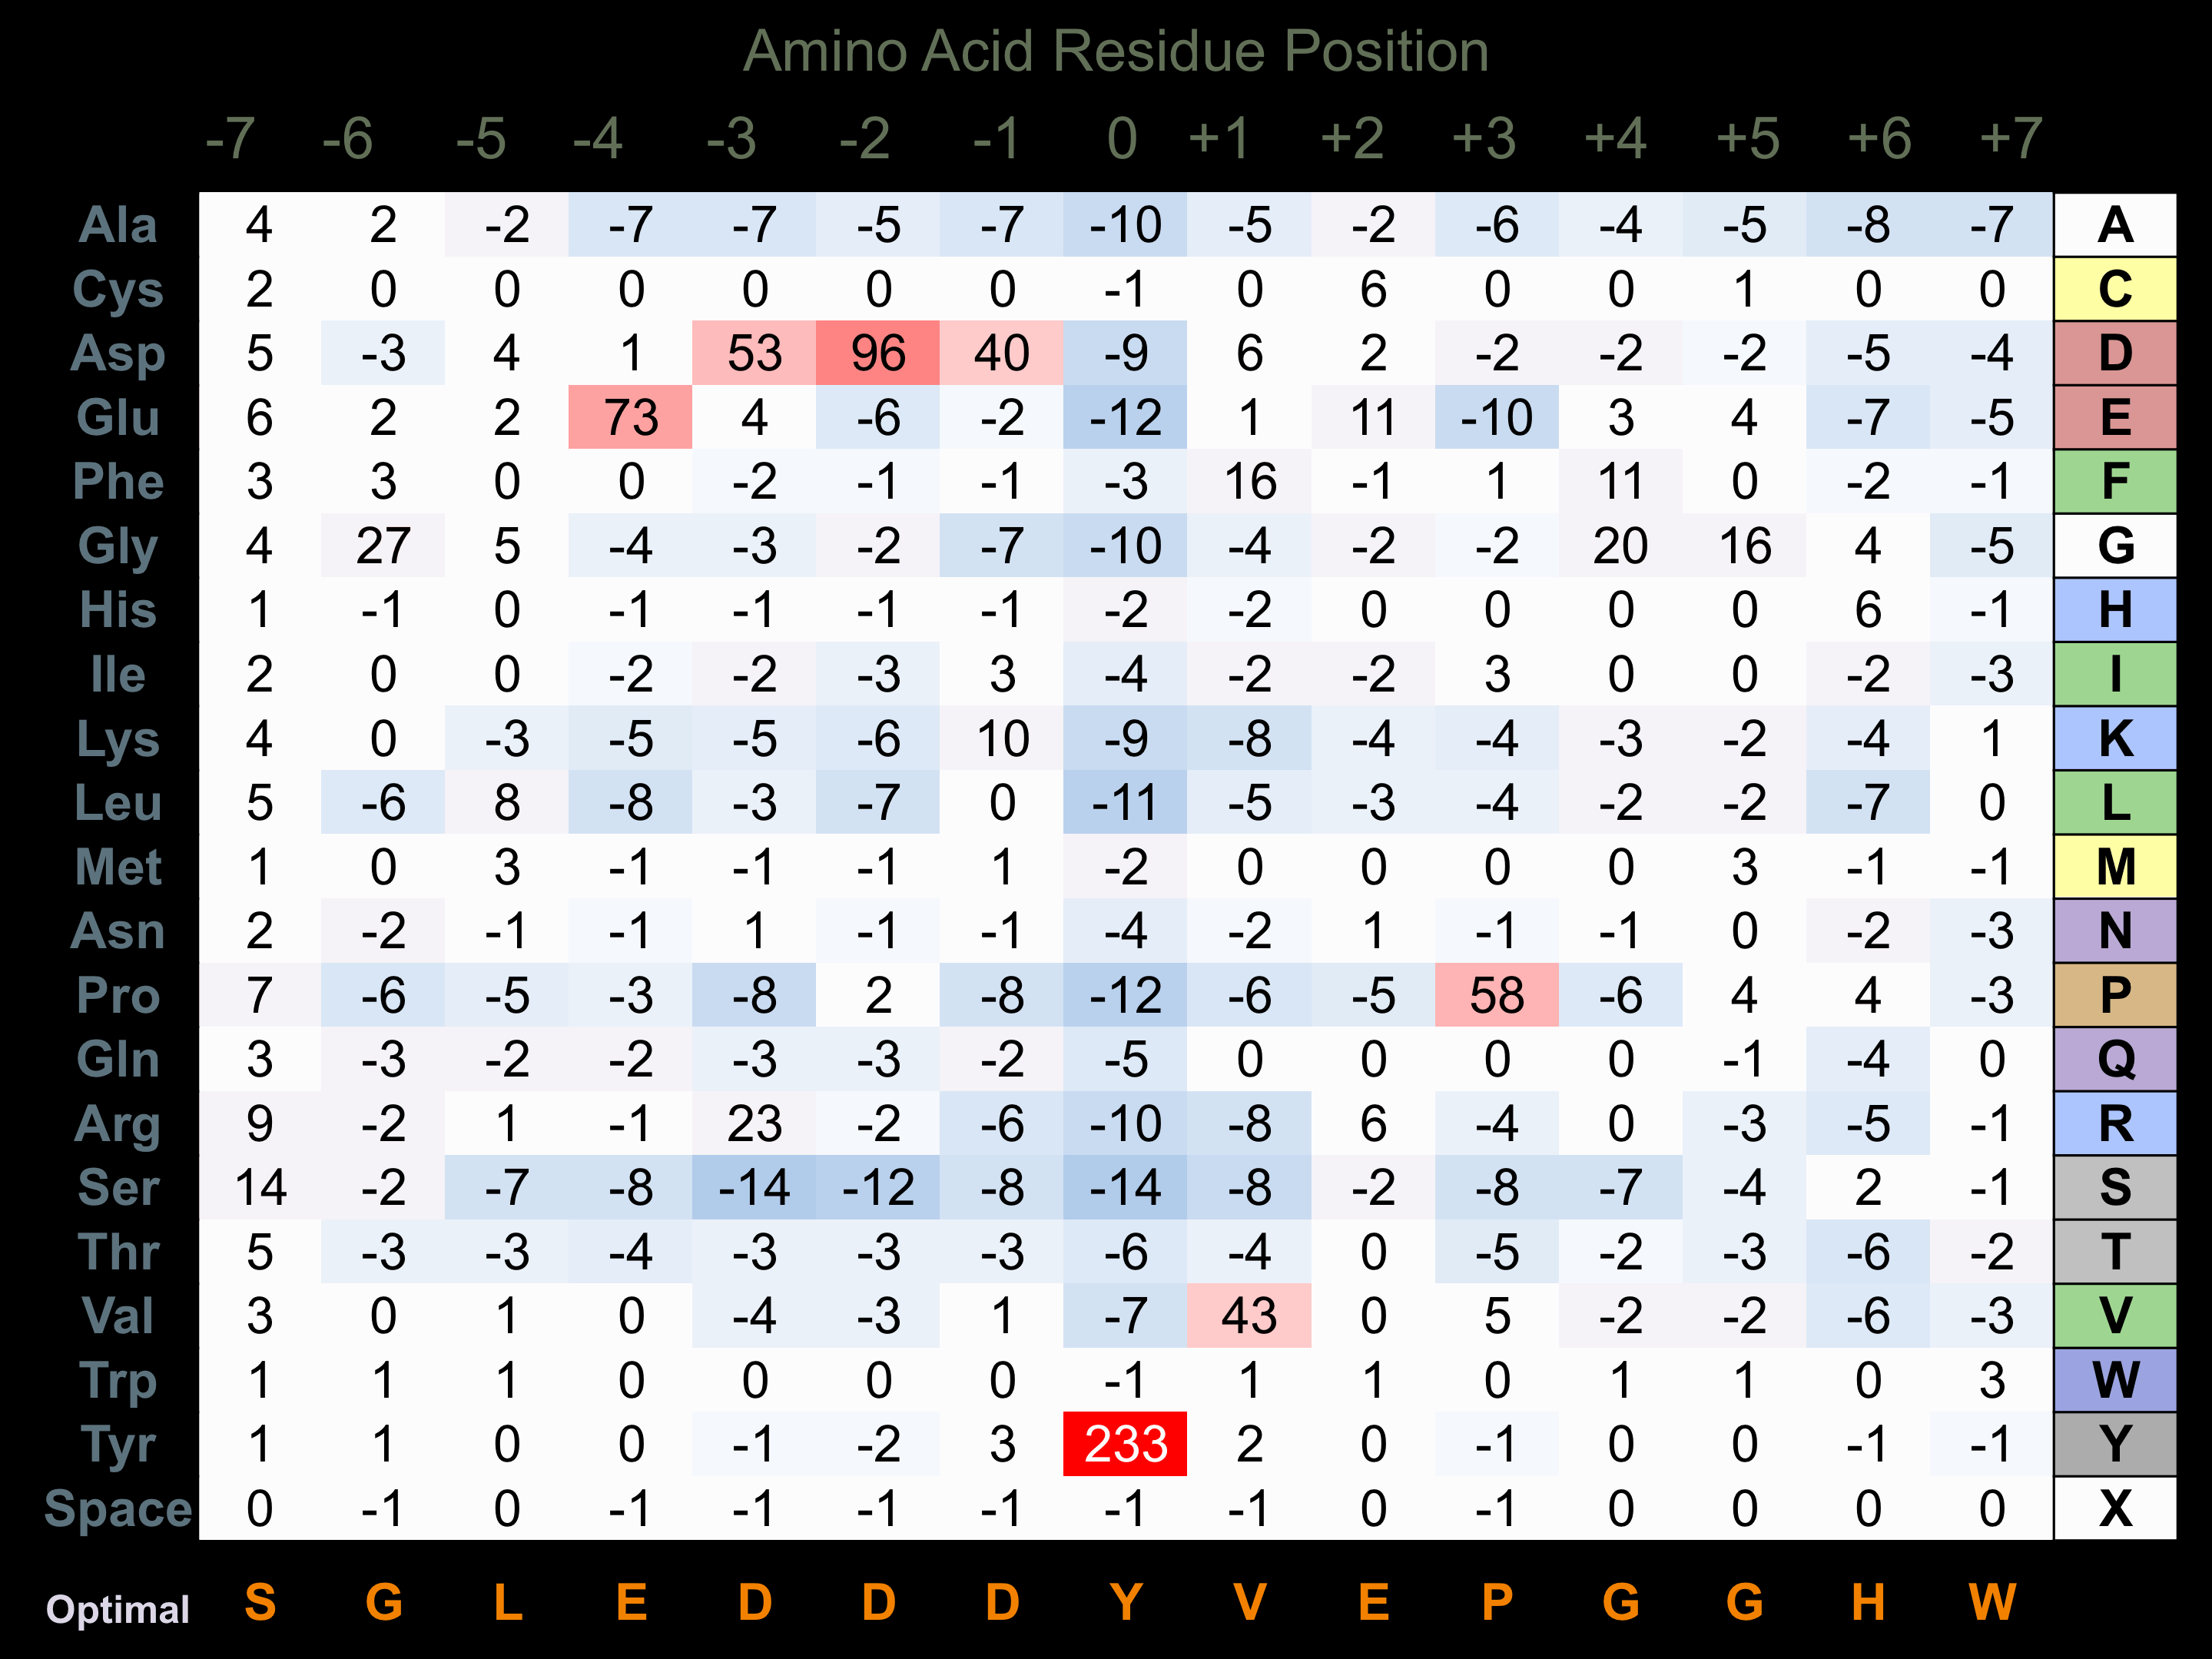
Matrix of observed frequency (%) of amino acids in aligned protein substrate phosphosites

Matrix Type:
Predicted from the application of the Kinexus Kinase Substrate Predictor Version 2.0 algorithm, which was trained with over 10,000 kinase-protein substrate pairs and 8,000 kinase-peptide substrate pairs.
Domain #:
1
Inhibitors
For further details on these inhibitors click on the Compound Name and enter it into DrugKiNET or click on the ID's
Based on in vitro and/or in vivo phosphorylation data
| Compound Name | KD, Ki or IC50 (nM) | PubChem ID | ChEMBL ID | PubMed ID |
|---|
| Dasatinib | Kd = 13 nM | 11153014 | 1421 | 18183025 |
| PDK1/Akt/Flt Dual Pathway Inhibitor | IC50 < 25 nM | 5113385 | 599894 | 22037377 |
| Lck Inhibitor | IC50 > 50 nM | 6603792 | 22037377 | |
| NVP-TAE684 | Kd = 180 nM | 16038120 | 509032 | 22037378 |
| Src Kinase Inhibitor I | IC50 > 250 nM | 1474853 | 97771 | 22037377 |
| Bosutinib | IC50 = 282 nM | 5328940 | 288441 | 19039322 |
| Foretinib | Kd = 310 nM | 42642645 | 1230609 | 22037378 |
| HDS029 | IC50 = 500 nM | 11566580 | 203644 | 22037377 |
| MLN8054 | Kd = 730 nM | 11712649 | 259084 | 22037378 |
| JNJ-7706621 | Kd = 1 µM | 5330790 | 191003 | 18183025 |
| NU6140 | IC50 > 1 µM | 10202471 | 1802728 | 22037377 |
| Ponatinib | IC50 > 1 µM | 24826799 | 20513156 | |
| WZ3146 | Kd > 1 µM | 44607360 | 20033049 | |
| WZ4002 | Kd > 1 µM | 44607530 | 20033049 | |
| Lestaurtinib | Kd = 1.2 µM | 126565 | 22037378 | |
| Staurosporine | Kd = 1.3 µM | 5279 | 18183025 | |
| Canertinib | Kd = 1.5 µM | 156414 | 31965 | 18183025 |
| JNJ-28312141 | Kd = 2 µM | 22037378 |
Disease Linkage
General Disease Association:
Immune disorder and neuronal disorders
Specific Diseases (Non-cancerous):
Transient erythroblastopenia of childhood (TEC); Behcet's disease (BD); B cell deficiency
Comments:
TEC is a major binder of dasatinib, which is used for BCR/ABL-positive CML treatment.
Gene Expression in Cancers:
TranscriptoNET (www.transcriptonet.ca) analysis with mRNA expression data retrieved from the National Center for Biotechnology Information's Gene Expression Omnibus (GEO) database, which was normalized against 60 abundantly and commonly found proteins, indicated altered expression for this protein kinase as shown here as the percent change from normal tissue controls (%CFC) as supported with the Student T-test in human Brain glioblastomas (%CFC= -46, p<0.015). The COSMIC website notes an up-regulated expression score for Tec in diverse human cancers of 293, which is 0.6-fold of the average score of 462 for the human protein kinases. The down-regulated expression score of 23 for this protein kinase in human cancers was 0.4-fold of the average score of 60 for the human protein kinases.
Mutagenesis Experiments:
Insertional mutagenesis studies in mice have not yet revealed a role for this protein kinase in mouse cancer oncogenesis.
Mutation Rate in All Cancers:
Percent mutation rates per 100 amino acids length in human cancers: 0.08 % in 25452 diverse cancer specimens. This rate is very similar (+ 10% higher) to the average rate of 0.075 % calculated for human protein kinases in general.
Mutation Rate in Specific Cancers:
Highest percent mutation rates per 100 amino acids length in human cancers: 0.41 % in 805 skin cancers tested; 0.39 % in 1093 large intestine cancers tested; 0.18 % in 1991 lung cancers tested.
Frequency of Mutated Sites:
None > 4 in 20,679 cancer specimens
Comments:
Only 2 deletions, 1 insertion, and no complex mutations are noted on the COSMIC website.

