
Nomenclature
Short Name:
ITK
Full Name:
Tyrosine-protein kinase ITK-TSK
Alias:
- EC 2.7.10.2
- MGC126258
- TLK
- TSK
- EMT
- Lyk
- PSCTK2
- MGC126257
Classification
Type:
Protein-tyrosine kinase
Group:
TK
Family:
Tec
SubFamily:
NA

Specific Links
Structure
Mol. Mass (Da):
71,831
# Amino Acids:
620
# mRNA Isoforms:
1
mRNA Isoforms:
71,831 Da (620 AA; Q08881)
4D Structure:
Ligation of CD2, TCR or CD28 induces activation and tyrosine phosphorylation of ITK. Interacts with THEMIS
1D Structure:
3D Image (rendered using PV Viewer):
PDB ID
Subfamily Alignment
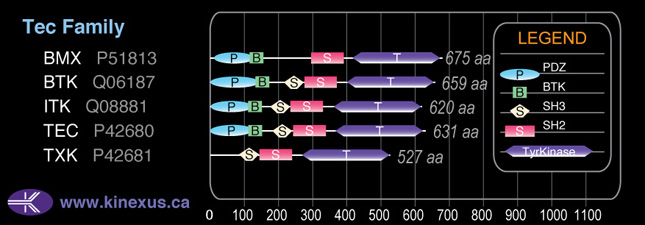
Domain Distribution:
Kinexus Products
Click on entries below for direct links to relevant products from Kinexus for this protein kinase.
hiddentext
Post-translation Modifications
For detailed information on phosphorylation of this kinase go to PhosphoNET
Acetylated:
K296 (N6).
Serine phosphorylated:
S22, S115, S203, S223, S224, S276, S499, S514, S515, S565.
Threonine phosphorylated:
T50, T141, T160, T184, T236, T274, T504, T513, T516, T518, T585.
Tyrosine phosphorylated:
Y40, Y90, Y120, Y146, Y180+, Y182, Y198, Y220, Y225, Y237, Y273, Y336, Y353, Y512+, Y588.
Ubiquitinated:
K138, K497.
Distribution
Based on gene microarray analysis from the NCBI
Human Tissue Distribution
% Max Expression:
Mean Expression:
Number of Samples:
Standard Deviation:
% Max Expression:
Mean Expression:
Number of Samples:
Standard Deviation:
 15
15
922
16
1130
 0.4
0.4
26
10
23
 0.7
0.7
44
17
73
 7
7
441
63
1332
 9
9
546
14
552
 0.6
0.6
36
37
21
 5
5
322
23
398
 13
13
760
39
1911
 4
4
261
10
227
 0.9
0.9
53
72
62
 0.6
0.6
39
32
39
 6
6
390
143
572
 4
4
267
28
163
 0.5
0.5
31
11
32
 0.7
0.7
41
29
65
 0.4
0.4
24
8
13
 0.3
0.3
18
199
26
 1.1
1.1
69
24
70
 0.5
0.5
33
71
35
 6
6
363
56
391
 0.5
0.5
31
28
43
 3
3
158
32
147
 0.8
0.8
51
34
82
 0.4
0.4
24
26
48
 7
7
397
30
354
 18
18
1088
45
2803
 2
2
147
31
79
 0.7
0.7
43
26
67
 0.4
0.4
27
26
44
 3
3
186
14
53
 35
35
2071
18
284
 100
100
6001
19
11488
 6
6
331
46
594
 10
10
588
36
682
 0.9
0.9
52
22
32
Evolution
Species Conservation
PhosphoNET % Identity:
PhosphoNET % Similarity:
Homologene %
Identity:
PhosphoNET % Identity:
PhosphoNET % Similarity:
Homologene %
Identity:
 100
100
100
100 99.7
99.7
99.7
100 99
99
99.5
99 -
-
-
96 -
-
-
- 80.6
80.6
83.2
95 -
-
-
- 93.4
93.4
95.8
94 32.3
32.3
50.3
94.5 -
-
-
- 72.9
72.9
78
- 50.4
50.4
68.3
78 32.3
32.3
50.3
- 58.7
58.7
74.3
60 -
-
-
- 37.4
37.4
53.2
- -
-
-
- -
-
-
- -
-
-
- -
-
-
- -
-
-
- -
-
-
- -
-
-
- -
-
-
- -
-
-
-
For a wider analysis go to PhosphoNET Evolution in PhosphoNET
Binding Proteins
Examples of known interacting proteins
hiddentext
| No. | Name – UniProt ID |
|---|---|
| 1 | CD28 - P10747 |
| 2 | LCP2 - Q13094 |
| 3 | PLCG1 - P19174 |
| 4 | SLC7A5 - Q01650 |
| 5 | SLC7A5P1 - Q8MH63 |
| 6 | WAS - P42768 |
| 7 | FYN - P06241 |
| 8 | GRB2 - P62993 |
| 9 | BLNK - Q8WV28 |
| 10 | SH2D2A - Q9NP31 |
| 11 | LCK - P06239 |
| 12 | SPNS1 - Q9H2V7 |
| 13 | KPNA2 - P52292 |
| 14 | PPIA - P62937 |
| 15 | CBL - P22681 |
Regulation
Activation:
Phosphorylation at Tyr-512 increases phosphotransferase activity.
Inhibition:
NA
Synthesis:
NA
Degradation:
NA
Known Upstream Kinases
For further details on these substrates click on the Substrate Short Name or UniProt ID. Phosphosite Location is hyperlinked to PhosphoNET
predictions.
Based on in vitro and/or in vivo phosphorylation data
| Kinase Short Name | UniProt ID (Human) | Phosphosite Location | Phosphosite Sequence | Effect of Phosphorylation |
|---|
Known Downstream Substrates
For further details on these substrates click on the Substrate Short Name or UniProt ID. Phosphosite Location is hyperlinked to PhosphoNET
predictions.
Based on in vitro and/or in vivo phosphorylation data
| Substrate Short Name | UniProt ID (Human) | Phosphosite Location | Phosphosite Sequence | Effect of Phosphorylation |
|---|
| Bmx (Etk) | P51813 | Y216 | SSTSLAQYDSNSKKI | |
| Btk | Q06187 | Y223 | LKKVVALYDYMPMNA | + |
| Itk | Q08881 | Y180 | ETVVIALYDYQTNDP | + |
| PLCG1 | P19174 | Y783 | EGRNPGFYVEANPMP | + |
| SIGLEC10 | Q96LC7 | Y597 | RHSTILDYINVVPTA | |
| SIGLEC10 | Q96LC7 | Y667 | ESQEELHYATLNFPG | |
| TBX21 | Q9UL17 | Y530 | KEAEGQFYNYFPN | ? |
| TEC | P42680 | Y206 | RLERGQEYLILEKND | |
| TIM3 | Q8TDQ0 | Y265 | IRSEENIYTIEENVY |
Protein Kinase Specificity
Matrix of observed frequency (%) of amino acids in aligned protein substrate phosphosites
Matrix Type:
Predicted from the application of the Kinexus Kinase Substrate Predictor Version 2.0 algorithm, which was trained with over 10,000 kinase-protein substrate pairs and 8,000 kinase-peptide substrate pairs.
Domain #:
1
Inhibitors
For further details on these inhibitors click on the Compound Name and enter it into DrugKiNET or click on the ID's
Based on in vitro and/or in vivo phosphorylation data
| Compound Name | KD, Ki or IC50 (nM) | PubChem ID | ChEMBL ID | PubMed ID |
|---|
Disease Linkage
General Disease Association:
Cancer, immune disorders
Specific Diseases (Non-cancerous):
Lymphoproliferative syndrome 1 (LPFS1); Lymphoproliferative syndrome, Ebv-Associated, autosomal, 1
Comments:
R335W mutation, which causes almost undetectable mutant ITK protein with severe protein instability, is associated with lymphoproliferative syndrome 1. Lymphoproliferative syndrome 1 is a rare immunodeficiency disease with strong susceptibility to Epstein-Barr virus infection, which can be fatal.
Specific Cancer Types:
Peripheral T-cell lymphomas (PTCL)
Comments:
Mutation of the ITK gene increases risks for lymphoma.
Gene Expression in Cancers:
TranscriptoNET (www.transcriptonet.ca) analysis with mRNA expression data retrieved from the National Center for Biotechnology Information's Gene Expression Omnibus (GEO) database, which was normalized against 60 abundantly and commonly found proteins, indicated altered expression for this protein kinase as shown here as the percent change from normal tissue controls (%CFC) as supported with the Student T-test in the following types of human cancers: Brain glioblastomas (%CFC= -58, p<0.1); Colon mucosal cell adenomas (%CFC= -51, p<0.0001); Colorectal adenocarcinomas (early onset) (%CFC= +95, p<0.042); Large B-cell lymphomas (%CFC= +60, p<0.055). The COSMIC website notes an up-regulated expression score for ITK in diverse human cancers of 219, which is 0.5-fold of the average score of 462 for the human protein kinases. The down-regulated expression score of 0 for this protein kinase in human cancers was 100% lower than the average score of 60 for the human protein kinases.
Mutagenesis Experiments:
Insertional mutagenesis studies in mice have not yet revealed a role for this protein kinase in mouse cancer oncogenesis.
Mutation Rate in All Cancers:
Percent mutation rates per 100 amino acids length in human cancers: 0.13 % in 25685 diverse cancer specimens. This rate is 1.8-fold higher than the average rate of 0.075 % calculated for human protein kinases in general.
Mutation Rate in Specific Cancers:
Highest percent mutation rates per 100 amino acids length in human cancers: 0.96 % in 805 skin cancers tested; 0.5 % in 1152 large intestine cancers tested; 0.32 % in 1942 lung cancers tested; 0.31 % in 629 stomach cancers tested; 0.11 % in 1466 breast cancers tested.
Frequency of Mutated Sites:
None > 6 in 20,803 cancer specimens
Comments:
Only 2 deletions, 1 insertion, and no complex mutations are noted on the COSMIC website.