
Nomenclature
Short Name:
DAPK1
Full Name:
Death-associated protein kinase 1
Alias:
- DAP kinase 1
- DAPK
- Death associated protein kinase
- DKFZp781I035
- EC 2.7.11.1
- Kinase DAPK1
Classification
Type:
Protein-serine/threonine kinase
Group:
CAMK
Family:
DAPK
SubFamily:
NA

Specific Links
Structure
Mol. Mass (Da):
160073
# Amino Acids:
1430
# mRNA Isoforms:
4
mRNA Isoforms:
161,237 Da (1440 AA; P53355-3); 160,046 Da (1430 AA; P53355); 152,467 Da (1364 AA; P53355-4); 36,765 Da (337 AA; P53355-2)
4D Structure:
Interacts with KLHL20.
1D Structure:
3D Image (rendered using PV Viewer):
PDB ID
Subfamily Alignment
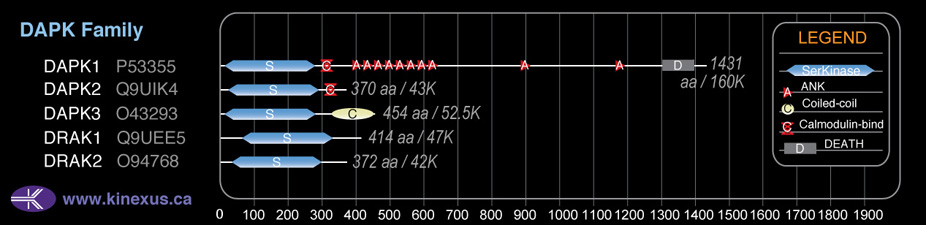
Domain Distribution:
Kinexus Products
Click on entries below for direct links to relevant products from Kinexus for this protein kinase.
hiddentext
Post-translation Modifications
For detailed information on phosphorylation of this kinase go to PhosphoNET
Acetylated:
K295, K297.
Serine phosphorylated:
S57, S289-, S308-, S319, S326, S333, S606, S724, S725, S728, S734+, S736+, S1117, S1267.
Threonine phosphorylated:
T1266, T1269.
Tyrosine phosphorylated:
Y12, Y13, Y39, Y490, Y491, Y493, Y1060.
Distribution
Based on gene microarray analysis from the NCBI
Human Tissue Distribution
% Max Expression:
Mean Expression:
Number of Samples:
Standard Deviation:
% Max Expression:
Mean Expression:
Number of Samples:
Standard Deviation:
 100
100
1556
29
2470
 4
4
69
15
62
 18
18
277
20
233
 25
25
383
109
480
 31
31
489
25
497
 10
10
163
86
403
 12
12
191
31
360
 72
72
1117
59
2128
 37
37
568
17
505
 10
10
156
75
150
 11
11
174
41
168
 64
64
993
183
1116
 12
12
194
42
182
 14
14
217
12
167
 16
16
251
35
241
 6
6
88
15
134
 22
22
341
191
2960
 5
5
73
29
128
 4
4
59
95
62
 30
30
466
109
521
 16
16
245
33
213
 12
12
193
37
161
 15
15
228
30
208
 6
6
97
29
91
 19
19
295
33
292
 30
30
464
73
581
 6
6
100
45
89
 10
10
159
29
140
 10
10
148
29
124
 8
8
120
28
121
 21
21
324
24
308
 65
65
1011
36
2288
 13
13
201
68
508
 85
85
1325
57
933
 13
13
196
35
135
Evolution
Species Conservation
PhosphoNET % Identity:
PhosphoNET % Similarity:
Homologene %
Identity:
PhosphoNET % Identity:
PhosphoNET % Similarity:
Homologene %
Identity:
 100
100
100
100 99.9
99.9
99.9
100 99.4
99.4
99.7
99 -
-
-
96 -
-
-
96 95.6
95.6
98
95.5 -
-
-
- 94.4
94.4
97.6
95 24.2
24.2
28.8
95 -
-
-
- -
-
-
- 60.7
60.7
65.8
80 86.1
86.1
93.8
87 74.8
74.8
87.2
75 -
-
-
- -
-
-
- -
-
-
- 34.5
34.5
54.5
36 29.5
29.5
45.9
- -
-
-
- -
-
-
- -
-
-
- -
-
-
- -
-
-
- -
-
-
-
For a wider analysis go to PhosphoNET Evolution in PhosphoNET
Regulation
Activation:
Phosphorylation at Ser-734 increases phosphotransferase activity.
Inhibition:
Phosphorylation at Ser-289 and Ser-308 inhibits phosphotransferase activity and interactions with calmodulin and CHIP.
Synthesis:
Up-regulated following treatment with interferon-gamma
Degradation:
NA
Known Upstream Kinases
For further details on these substrates click on the Substrate Short Name or UniProt ID. Phosphosite Location is hyperlinked to PhosphoNET
predictions.
Based on in vitro and/or in vivo phosphorylation data
| Kinase Short Name | UniProt ID (Human) | Phosphosite Location | Phosphosite Sequence | Effect of Phosphorylation |
|---|
Known Downstream Substrates
For further details on these substrates click on the Substrate Short Name or UniProt ID. Phosphosite Location is hyperlinked to PhosphoNET
predictions.
Based on in vitro and/or in vivo phosphorylation data
| Substrate Short Name | UniProt ID (Human) | Phosphosite Location | Phosphosite Sequence | Effect of Phosphorylation |
|---|
| BECN1 | Q14457 | T119 | LSRRLKVTGDLFDIM | - |
| CaMKK2 | Q96RR4 | S511 | RREERSLSAPGNLLT | |
| DAPK1 | P53355 | S308 | ARKKWKQSVRLISLC | - |
| GRIN2B (NMDAR2B ) | Q13224 | S1303 | NKLRRQHSYDTFVDL | - |
| MCM3 | P25205 | S160 | KTIERRYSDLTTLVA | |
| MRLC1 (MYL9) | P24844 | S20 | KRPQRATSNVFAMFD | |
| MRLC2 (MYL12B) | P19105 | S20 | KRPQRATSNVFAMFD | |
| MRLC2 (MYL12B) | P19105 | T19 | KKRPQRATSNVFAMF | + |
| p53 | P04637 | S20 | PLSQETFSDLWKLLP | + |
| p53 | P04637 | T18 | EPPLSQETFSDLWKL | + |
| SRF | P11831 | T159 | DNKLRRYTTFSKRKT | |
| STX1A | Q16623 | S188 | IIMDSSISKQALSEI |
Protein Kinase Specificity
Matrix of observed frequency (%) of amino acids in aligned protein substrate phosphosites
Matrix Type:
Experimentally derived from alignment of 12 known protein substrate phosphosites and 10 peptides phosphorylated by recombinant DAPK1 in vitro tested in-house by Kinexus.
Domain #:
1
Inhibitors
For further details on these inhibitors click on the Compound Name and enter it into DrugKiNET or click on the ID's
Based on in vitro and/or in vivo phosphorylation data
| Compound Name | KD, Ki or IC50 (nM) | PubChem ID | ChEMBL ID | PubMed ID |
|---|
Disease Linkage
General Disease Association:
Cancer
Specific Cancer Types:
Central nervous system lymphomas (CNSL); Cervical squamous cell carcinomas; Choroid plexus papillomas (CPP); Pediatric lymphomas
Comments:
DAPK1 appears to be a tumour suppressor protein (TSP). Cancer-related mutations in human tumours point to a loss of function of the protein kinase. Loss of expression of DAPK1 has been observed in many types of cancer. In mouse lung carcinoma studies, it has been shown that clones with highly aggressive metastatic behavior did not express DAPK, and restoration of DAPK suppressed lung cancer metastasis. Another study showed that epigenetic silencing of DAPK1 by promoter methylation is found in almost all cases of sporadic chronic lymphocytic leukemia.
Gene Expression in Cancers:
TranscriptoNET (www.transcriptonet.ca) analysis with mRNA expression data retrieved from the National Center for Biotechnology Information's Gene Expression Omnibus (GEO) database, which was normalized against 60 abundantly and commonly found proteins, indicated altered expression for this protein kinase as shown here as the percent change from normal tissue controls (%CFC) as supported with the Student T-test in the following types of human cancers: Bladder carcinomas (%CFC= +111, p<0.033); Brain glioblastomas (%CFC= +314, p<0.037); Classical Hodgkin lymphomas (%CFC= +226, p<0.023); Oral squamous cell carcinomas (OSCC) (%CFC= +93, p<0.007); Ovary adenocarcinomas (%CFC= -75, p<0.005); Prostate cancer - primary (%CFC= +53, p<0.0009); and Uterine fibroids (%CFC= -57, p<0.019). The COSMIC website notes an up-regulated expression score for DAPK1 in diverse human cancers of 347, which is 0.8-fold of the average score of 462 for the human protein kinases. The down-regulated expression score of 8 for this protein kinase in human cancers was 0.1-fold of the average score of 60 for the human protein kinases.
Mutagenesis Experiments:
Insertional mutagenesis studies in mice support a role for this protein kinase in mouse cancer oncogenesis.
Mutation Rate in All Cancers:
Percent mutation rates per 100 amino acids length in human cancers: 0.08 % in 24751 diverse cancer specimens. This rate is very similar (+ 6% higher) to the average rate of 0.075 % calculated for human protein kinases in general.
Mutation Rate in Specific Cancers:
Highest percent mutation rates per 100 amino acids length in human cancers: 0.53 % in 1093 large intestine cancers tested; 0.29 % in 602 endometrium cancers tested; 0.23 % in 589 stomach cancers tested; 0.21 % in 805 skin cancers tested; 0.15 % in 500 urinary tract cancers tested; 0.12 % in 1226 kidney cancers tested; 0.09 % in 1619 lung cancers tested; 0.08 % in 1292 breast cancers tested.
Frequency of Mutated Sites:
Most frequent mutations with the number of reports indicated in brackets: F119C (9). These mutations are located in the kinase catalytic domain.
Comments:
Only 1 deletion and 1 insertion and no complex mutations are noted on the COSMIC website.