• KinATLAS
  • TranscriptoNET
  • PhosphoNET
  • OncoNET
  • KinaseNET
  • DrugKiNET
  • DrugProNET
  • KiNET-AM
  • Kinetica Online

Updated November 2019

Home | Kinexus | Contact | Credits

Nomenclature

Short Name:
MST2
Full Name:
Serine-threonine-protein kinase 3
Alias:
  • EC 2.7.11.1
  • FLJ90748
  • CLIK1
  • Krs-1
  • MESS1
  • Serine,threonine protein kinase 3
  • STK3

Classification

Type:
Protein-serine/threonine kinase
Group:
STE
Family:
STE20
SubFamily:
MST


Specific Links

Entrez-Gene Entry: 6788
Entrez-Protein Entry: NP_006272
GeneCards Entry: MST2
KinBASE Entry: MST2
OMIM Entry: 605030
Pfam Entry: Q13188
PhosphoNET Entry: Q13188
Phosphosite Plus Entry: 770
ScanSite Entry: Q13188
Source Entry: STK3
UCSD-Nature Entry: A001347
UniProt Entry: Q13188

General Links

ClustalW2
GPS-Cuckoo
Human Protein Atlas
Kinase.com
Kinase Research
Kinasource
Kinomer
Netphorest
NetworKIN
Phosida
PhosphoElm
Protein Blast
ScanSite
String

Structure

Mol. Mass (Da):
56,301
# Amino Acids:
491
# mRNA Isoforms:
2
mRNA Isoforms:
59,462 Da (519 AA; Q13188-2); 56,301 Da (491 AA; Q13188)
4D Structure:
Homodimer; mediated via the coiled-coil region. Interacts with NORE1, which inhibits autoactivation By similarity. Interacts with and stabilizes SAV1. Interacts with RAF1, which prevents dimerization and phosphorylation. Interacts with RASSF1, which leads to enzyme activation
1D Structure:
Retrieve Gene Sequence
Retrieve Full Protein Sequence
Retrieve Catalytic Domain Sequence
 
3D Image (rendered using PV Viewer):

PDB ID
4LG4

Subfamily Alignment
subfamily domain
 
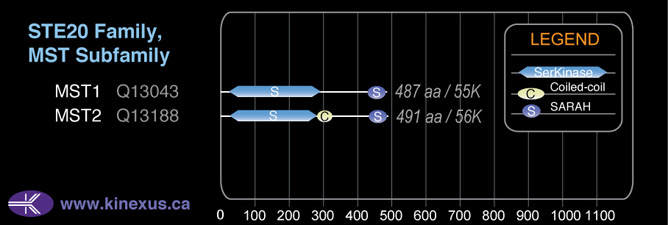
Domain Distribution:
Start End Domain
27 278 Pkinase
287 323 Coiled-coil
437 484 SARAH
 

Post-translation Modifications

For detailed information on phosphorylation of this kinase go to PhosphoNET
Serine phosphorylated:

S15, S18, S316, S323, S333, S385, S392, S444..
Threonine phosphorylated:

T117-, T172+, T174+, T180+, T235, T240, T325, T336, T384-.
Tyrosine phosphorylated:

Y81, Y396.
Ubiquitinated:
K56, K116, K148, K161, K177, K243, K298.
 

Distribution

Based on gene microarray analysis from the NCBI
Human Tissue Distribution
% Max Expression:

Mean Expression:

Number of Samples:

Standard Deviation:
% Max Expression:

Mean Expression:

Number of Samples:

Standard Deviation:
  • adipose
    72

    834

    29

    1008

  • adrenal
    4

    45

    15

    44

  • bladder
    5

    59

    2

    74

  • brain
    29

    331

    85

    588

  • breast
    61

    700

    24

    645

  • cervix
    11

    122

    88

    191

  • colon
    16

    188

    31

    416

  • heart
    100

    1155

    33

    2268

  • intestine
    33

    383

    17

    316

  • kidney
    5

    63

    72

    58

  • liver
    4

    43

    19

    45

  • lung
    44

    505

    173

    569

  • lymphnode
    2

    18

    24

    19

  • ovary
    9

    104

    12

    109

  • pancreas
    3

    34

    14

    27

  • pituitary
    5

    57

    15

    48

  • prostate
    22

    249

    112

    1315

  • salivarygland
    2

    25

    10

    16

  • skeletalmuscle"
    4

    47

    77

    58

  • skin
    48

    552

    109

    649

  • spinalcord
    4

    41

    13

    22

  • spleen
    3

    33

    16

    30

  • stomach
    2

    20

    20

    26

  • testis
    3

    34

    11

    24

  • thymus
    1.3

    15

    13

    17

  • thyroid
    80

    922

    51

    1405

  • tonsil
    2

    18

    27

    16

  • trachea
    2

    19

    11

    16

  • uterus
    6

    66

    11

    46

  • reticulocytes"
    0.9

    10

    28

    9

  • t-lymphocytes
    46

    535

    24

    541

  • b-lymphocytes
    33

    376

    36

    393

  • neutrophils
    18

    205

    67

    418

  • macrophages
    59

    684

    62

    644

  • sperm
    16

    189

    35

    287


Evolution

Species Conservation
PhosphoNET % Identity:
PhosphoNET % Similarity:
Homologene %
Identity:
PhosphoNET % Identity:
PhosphoNET % Similarity:
Homologene %
Identity:
  • tableheader
    100

    100

    100
  • tableheader
    86.8

    86.8

    100
  • tableheader
    78.6

    89.8

    100
  • tableheader
    -

    -

    100
  • tableheader
    -

    -

    96
  • tableheader
    99.4

    99.6

    99
  • tableheader
    -

    -

    -
  • tableheader
    95.8

    97.2

    97
  • tableheader
    96.7

    98.4

    97
  • tableheader
    -

    -

    -
  • tableheader
    53.2

    56.4

    -
  • tableheader
    79.4

    88.2

    98
  • tableheader
    93.7

    96.3

    94
  • tableheader
    89.4

    93.5

    89
  • tableheader
    -

    -

    -
  • tableheader
    46.2

    58.6

    46
  • tableheader
    66.4

    75.6

    -
  • tableheader
    51.5

    67

    74
  • tableheader
    65

    78.6

    -
  • tableheader
    -

    -

    -
  • tableheader
    -

    -

    -
  • tableheader
    -

    -

    43
  • tableheader
    -

    -

    43
  • tableheader
    -

    -

    -
  • tableheader
    -

    -

    -
For a wider analysis go to PhosphoNET Evolution in PhosphoNET
 

Binding Proteins

Examples of known interacting proteins
hiddentext
No. Name – UniProt ID
1 SAV1 - Q9H4B6
2 CASP3 - P42574
3 RAF1 - P04049
4 LATS1 - O95835
 

Regulation

Activation:
Activated by caspase-cleavage. Full activation also requires homodimerization and autophosphorylation of Thr-180, which are inhibited by Raf1.
Inhibition:
Inhibited by the C-terminal non-catalytic region.
Synthesis:
NA
Degradation:
NA
 

Known Upstream Kinases

For further details on these substrates click on the Substrate Short Name or UniProt ID. Phosphosite Location is hyperlinked to PhosphoNET predictions.
Based on in vitro and/or in vivo phosphorylation data

Kinase Short Name UniProt ID (Human) Phosphosite Location Phosphosite Sequence Effect of Phosphorylation
Akt1 P31749 T117 IIRLRNkTLIEDEIA -
MST2 Q13188 T180 DTMAKRNTVIGTPFW +
Akt1 P31749 T384 GTMKRNATSPQVQRP -
 

Known Downstream Substrates

For further details on these substrates click on the Substrate Short Name or UniProt ID. Phosphosite Location is hyperlinked to PhosphoNET predictions.
Based on in vitro and/or in vivo phosphorylation data

Substrate Short Name UniProt ID (Human) Phosphosite Location Phosphosite Sequence Effect of Phosphorylation
Abl1 P00519 T735 DTEWRSVTLPRDLQS +
LATS1 O95835 S872 GDHPRQDSMDFSNEW +
LATS1 O95835 S909 HQRCLAHSLVGTPNY +
LATS1 O95835 T1012 KAHPFFKTIDFSSDL
LATS1 O95835 T1060 EEENVNDTLNGWYKN
LATS1 O95835 T1079 EHAFYEFTFRRFFDD +
LATS1 O95835 T967 MKVINWQTSLHIPPQ
MOBKL1A (MOB1B) Q7L9L4 T12 FGSRSSKTFKPKKNI +
MOBKL1A (MOB1B) Q7L9L4 T35 LLKHAEATLGSGNLR +
MOBKL1B (MOB1A) Q9H8S9 T74 QINMLYGTITEFCTE +
MST2 (CLIK1, STK3) Q13188 T180 DTMAKRNTVIGTPFW +
YAP1 P46937 S127 PQHVRAHSSPASLQL
 

Protein Kinase Specificity

Matrix of observed frequency (%) of amino acids in aligned protein substrate phosphosites

Kinections GIF
Matrix Type:
Predicted from the application of the Kinexus Kinase Substrate Predictor Version 2.0 algorithm, which was trained with over 10,000 kinase-protein substrate pairs and 8,000 kinase-peptide substrate pairs.
Domain #:
1
 

Inhibitors

For further details on these inhibitors click on the Compound Name and enter it into DrugKiNET or click on the ID's
Based on in vitro and/or in vivo phosphorylation data
Compound Name KD, Ki or IC50 (nM) PubChem ID ChEMBL ID PubMed ID
Staurosporine Kd = 180 pM 5279 18183025
7-hydroxystaurosporine IC50 < 2 nM 72271 1236539
Lestaurtinib Kd = 2.4 nM 126565 22037378
TTT-3002 IC50 < 4 nM
BX517 IC50 < 8 nM 11161844 228654
AC1NS4N8 Kd < 10 nM 23649240 19035792
Hesperadin Kd < 10 nM 10142586 514409 19035792
N-Benzoylstaurosporine Kd = 17 nM 56603681 608533 19654408
Sunitinib Kd = 19 nM 5329102 535 18183025
Cdk1/2 Inhibitor III IC50 < 25 nM 5330812 261720 22037377
Gö6976 IC50 < 25 nM 3501 302449 22037377
JAK3 Inhibitor VI IC50 < 25 nM 16760524 22037377
K-252a; Nocardiopsis sp. IC50 < 25 nM 3813 281948 22037377
PKR Inhibitor IC50 < 25 nM 6490494 235641 22037377
SB218078 IC50 < 25 nM 447446 289422 22037377
Nintedanib Kd = 38 nM 9809715 502835 22037378
Gö6976 IC50 < 40 nM 3501 302449
Gö7874 IC50 < 40 nM 5327863
GSK-3 Inhibitor IX IC50 < 40 nM 5287844 409450
Princeton's TrkA inhibitor compound 20h IC50 < 40 nM
Staurosporine aglycone IC50 < 40 nM 3035817 281948
SureCN3470757 IC50 < 40 nM 11588244 375236
Wyeth PDK1 Inhibitor Compound 1 IC50 < 40 nM
BCP9000906 IC50 > 50 nM 5494425 21156 22037377
IDR E804 IC50 > 50 nM 6419764 1802727 22037377
PF-03814735 IC50 < 50 nM 49830590 20354118
SU9516 IC50 > 50 nM 5289419 258805 22037377
Neratinib Kd = 58 nM 9915743 180022 22037378
A 443654 IC50 < 60 nM 10172943 379300
Ro-31-8220 IC50 < 60 nM 5083 6291
Syk Inhibitor IC50 < 60 nM 6419747 104279
JNJ-7706621 Kd = 61 nM 5330790 191003 18183025
SU14813 Kd = 65 nM 10138259 1721885 18183025
LKB1(AAK1 dual inhibitor) Kd = 75 nM 44588117 516312 19035792
Ruboxistaurin IC50 < 80 nM 153999 91829
AT9283 IC50 > 100 nM 24905142 19143567
BI-D1870 IC50 = 100 nM 25023738 573107
CHEMBL1650545 IC50 > 100 nM 53316611 1650545 21128646
GW 843682X IC50 = 100 nM 9826308 514499
SU6656 IC50 < 100 nM 5353978 605003
IKK-2 Inhibitor IV Kd < 150 nM 9903786 257167 19035792
Indirubin-3′-monoxime IC50 > 150 nM 5326739 22037377
SU11652 IC50 > 150 nM 24906267 13485 22037377
Tozasertib Kd < 150 nM 5494449 572878 19035792
Bosutinib IC50 = 191 nM 5328940 288441 19039322
Dovitinib Kd = 200 nM 57336746 18183025
AG-E-60384 IC50 > 250 nM 6419741 413188 22037377
Alsterpaullone; 2-Cyanoethyl IC50 > 250 nM 16760286 260138 22037377
Bisindolylmaleimide I IC50 > 250 nM 2396 7463 22037377
Flt-3 Inhibitor II IC50 > 250 nM 11601743 377193 22037377
GSK-3 Inhibitor X IC50 > 250 nM 6538818 430226 22037377
PKR Inhibitor; Negative Control IC50 > 250 nM 16760619 22037377
PP121 IC50 < 250 nM 24905142 18849971
NVP-TAE684 Kd = 310 nM 16038120 509032 22037378
IKK-3 inhibitor IX IC50 < 400 nM 11626927 373751
GTP-14564 IC50 = 500 nM 3385203 406375 22037377
PKCb Inhibitor IC50 = 500 nM 6419755 366266 22037377
CHEMBL590109 = 570 nM 46224684 590109
Aurora A Inhibitor 1 (DF) Kd < 600 nM 21992004
GSK650394A IC50 < 600 nM 25022668 558642
KT5720 IC50 < 600 nM 3844 608532
PP242 IC50 < 600 nM 25243800
Purvalanol A IC50 < 600 nM 456214 23327
Kinome_714 IC50 = 650 nM 46886323 20346655
CHEMBL1240703 Kd = 760 nM 52945601 1240703 19654408
1;9-Pyrazoloanthrone IC50 < 800 nM 8515 7064
GW441756 hydrochloride IC50 < 800 nM 16219400
GW5074 (Raf1 Kinase Inhibitor I) IC50 < 800 nM 5924208
AST-487 Kd = 860 nM 11409972 574738 18183025
Crizotinib Kd = 990 nM 11626560 601719 22037378
1-Naphthyl PP1 IC50 = 1 µM 4877
Alsterpaullone IC50 = 1 µM 5005498 50894 17850214
ALX-270-403-M001 IC50 > 1 µM 22037377
Bisindolylmaleimide IV IC50 > 1 µM 2399 266487 22037377
GSK-3 Inhibitor XIII IC50 > 1 µM 6419766 359482 22037377
H-1152; Glycyl IC50 = 1 µM 16760635
H-89 IC50 > 1 µM 449241 104264 22037377
Kenpaullone IC50 = 1 µM 3820 296586
MK5108 IC50 > 1 µM 24748204 20053775
NU6140 IC50 > 1 µM 10202471 1802728 22037377
NVP-BEZ235 IC50 = 1 µM 11977753 1879463
Orantinib IC50 = 1 µM 5329099 274654
PP1 Analog II; 1NM-PP1 IC50 = 1 µM 5154691 573578
Purvalanol B IC50 = 1 µM 448991 23254
Quercetagetin IC50 = 1 µM 5281680 413552
R406 IC50 = 1 µM 11984591
SB415286 IC50 < 1 µM 4210951 322970
Semaxinib IC50 = 1 µM 5329098 276711
Silmitasertib IC50 > 1 µM 24748573 21174434
SNS314 IC50 > 1 µM 16047143 514582 18678489
SureCN10063060 Ki > 1 µM 52936621 21391610
Syk Inhibitor II IC50 = 1 µM 16760670
Syk Inhibitor IV IC50 = 1 µM 10200390
VEGFR2 Kinase Inhibitor II IC50 > 1 µM 5329155 88606 22037377
Vemurafenib IC50 = 1 µM 42611257 1229517
WZ3146 Kd > 1 µM 44607360 20033049
WZ4002 Kd > 1 µM 44607530 20033049
SureCN7018367 Kd < 1.25 µM 18792927 450519 19035792
Linifanib Kd = 1.4 µM 11485656 223360 18183025
Enzastaurin Kd = 1.9 µM 176167 300138 22037378
PHA-665752 Kd = 1.9 µM 10461815 450786 22037378
Momelotinib IC50 > 2 µM 25062766 19295546
SB202190 IC50 = 2 µM 5353940 278041
Axitinib Kd = 2.2 µM 6450551 1289926 22037378
Pelitinib Kd = 2.4 µM 6445562 607707 18183025
CHEMBL249097 Kd < 2.5 µM 25138012 249097 19035792
SureCN373973 Kd < 2.5 µM 9818573 30678 19035792
Amgen TBK 1 inhibitor (Compound II) IC50 > 3 µM
BMS-690514 Kd < 3 µM 11349170 21531814
JNKIN7 IC50 > 3 µM 57340685
Ruxolitinib IC50 > 3 µM 25126798 1789941
Tofacitinib IC50 > 3 µM 9926791 221959
BX795 IC50 < 4 µM 10077147 577784
JNJ-28871063 IC50 > 4 µM 17747413 17975007
Harmane IC50 > 4.5 µM 5281404 12014
JNKIN8 IC50 > 4.5 µM 57340686
KIN 112 IC50 > 4.5 µM
 

Disease Linkage

General Disease Association:

Cancer
Comments:
MST2 might be a tumour suppressor protein (TSP). MST2 may function in a way similar to a growth suppressor. The protein is critical in organ size control and tumour suppression by restricting proliferation and promoting apoptosis. MST2 levels are up-regulated almost 3-fold higher in human cancers when compared to most other protein kinases.
 
Gene Expression in Cancers:

TranscriptoNET (www.transcriptonet.ca) analysis with mRNA expression data retrieved from the National Center for Biotechnology Information's Gene Expression Omnibus (GEO) database, which was normalized against 60 abundantly and commonly found proteins, indicated altered expression for this protein kinase as shown here as the percent change from normal tissue controls (%CFC) as supported with the Student T-test in the following types of human cancers: Cervical cancer (%CFC= -67, p<(0.0003); Colon mucosal cell adenomas (%CFC= +58, p<0.012); Head and neck squamous cell carcinomas (HNSCC) (%CFC= +68, p<0.005); and Oral squamous cell carcinomas (OSCC) (%CFC= +128, p<0.007). The COSMIC website notes an up-regulated expression score for MST2 in diverse human cancers of 1337, which is 2.9-fold of the average score of 462 for the human protein kinases. The down-regulated expression score of 76 for this protein kinase in human cancers was 1.3-fold of the average score of 60 for the human protein kinases.
Mutagenesis Experiments:

Insertional mutagenesis studies in mice have not yet revealed a role for this protein kinase in mouse cancer oncogenesis. A K56R mutation can abrogate phosphotransferase activity, and D322N substitution can produce resistant to proteolytic cleavage.
Mutation Rate in All Cancers:

Percent mutation rates per 100 amino acids length in human cancers: 0.07 % in 25371 diverse cancer specimens. This rate is only -6 % lower and is very similar to the average rate of 0.075 % calculated for human protein kinases in general.
Mutation Rate in Specific Cancers:

Highest percent mutation rates per 100 amino acids length in human cancers: 0.41 % in 602 endometrium cancers tested; 0.28 % in 1093 large intestine cancers tested.
Frequency of Mutated Sites:

None > 3 in 20,655 cancer specimens
Comments:
Only 3 deletions, 1 insertion, and no complex mutations are noted on the COSMIC website.
 
COSMIC Entry:
STK3
OMIM Entry:
605030
  • Home
  • Top of Page
Copyright 2019 Kinexus BioInformatics Corporation