
Nomenclature
Short Name:
PKN1
Full Name:
Protein kinase N1
Alias:
- EC 2.7.11.13
- Protease-activated kinase 1
- Protein kinase C-like 1
- Protein kinase C-like PKN
- Protein-kinase C-related kinase 1
- PAK-1
- PKN
- PRK1
- PRKCL1
Classification
Type:
Protein-serine/threonine kinase
Group:
AGC
Family:
PKN
SubFamily:
NA

Specific Links
Structure
Mol. Mass (Da):
103932
# Amino Acids:
942
# mRNA Isoforms:
3
mRNA Isoforms:
104,673 Da (948 AA; Q16512-2); 103,932 Da (942 AA; Q16512); 66,060 Da (603 AA; Q16512-3)
4D Structure:
Interacts with ZA20D3 By similarity. Interacts with ANDR. Interacts with PRKCB. Interacts (via REM 1 and REM 2 repeats) with RAC1. Interacts (via REM 1 repeat) with RHOA. Interacts with RHOB. In case of infection, interacts with S.typhimurium protein sspH1.
3D Structure:
1D Structure:
3D Image (rendered using PV Viewer):
PDB ID
Subfamily Alignment
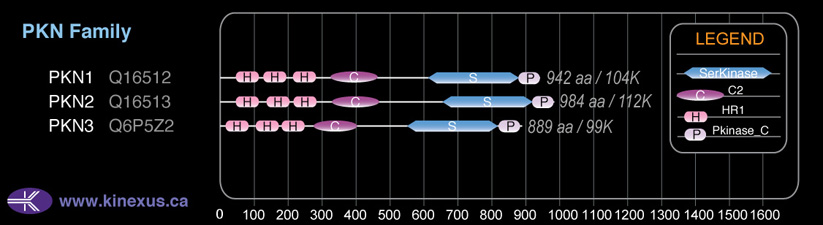
Domain Distribution:
Kinexus Products
Click on entries below for direct links to relevant products from Kinexus for this protein kinase.
hiddentext
Post-translation Modifications
For detailed information on phosphorylation of this kinase go to PhosphoNET
Acetylated:
A2, K448.
Methylated:
R366.
Serine phosphorylated:
S3, S69, S80, S112, S205, S240, S301, S372, S374, S376, S379, S380, S495, S533, S537, S540, S549, S559, S561, S562, S575, S576, S577, S608, S773+, S902, S916.
Threonine phosphorylated:
T63, T64, T315, T353, T527, T529, T531, T557, T611, T772+, T774+, T778-, T914, T925.
Tyrosine phosphorylated:
Y768.
Ubiquitinated:
K263.
Distribution
Based on gene microarray analysis from the NCBI
Human Tissue Distribution
% Max Expression:
Mean Expression:
Number of Samples:
Standard Deviation:
% Max Expression:
Mean Expression:
Number of Samples:
Standard Deviation:
 41
41
734
16
883
 6
6
107
10
34
 14
14
241
22
167
 24
24
419
69
863
 43
43
756
12
650
 2
2
43
40
81
 19
19
340
19
621
 38
38
673
44
1475
 10
10
177
10
146
 8
8
143
68
140
 27
27
481
37
2004
 31
31
551
128
580
 16
16
284
33
246
 6
6
106
9
85
 8
8
137
13
148
 8
8
149
8
66
 8
8
143
122
119
 10
10
174
29
129
 8
8
137
70
83
 22
22
392
56
449
 13
13
233
33
157
 18
18
322
35
240
 12
12
206
31
170
 8
8
135
29
93
 14
14
242
33
195
 45
45
807
48
1675
 11
11
193
36
184
 12
12
215
29
172
 13
13
222
29
149
 6
6
109
14
87
 51
51
911
30
583
 100
100
1774
21
2731
 19
19
329
50
654
 38
38
677
31
617
 1.4
1.4
25
22
15
Evolution
Species Conservation
PhosphoNET % Identity:
PhosphoNET % Similarity:
Homologene %
Identity:
PhosphoNET % Identity:
PhosphoNET % Similarity:
Homologene %
Identity:
 100
100
100
100 79.4
79.4
79.9
99 38.8
38.8
52.6
96 -
-
-
96 -
-
-
98 83.1
83.1
84.4
95 -
-
-
- 91.7
91.7
94.7
92 92
92
94.6
92.5 -
-
-
- 42.3
42.3
56.2
- 57.6
57.6
72.2
- -
-
-
79 66.8
66.8
79.5
69 -
-
-
- 29.1
29.1
42.9
- -
-
-
- 27.8
27.8
43.4
- 48.5
48.5
61.8
- -
-
-
- -
-
-
- -
-
-
- -
-
-
- 25.9
25.9
44.5
- 28.4
28.4
45.1
-
For a wider analysis go to PhosphoNET Evolution in PhosphoNET
Binding Proteins
Examples of known interacting proteins
hiddentext
| No. | Name – UniProt ID |
|---|---|
| 1 | ACTN1 - P12814 |
| 2 | NEFH - P12036 |
| 3 | CCNT2 - O60583 |
| 4 | NEFL - P07196 |
| 5 | ZFAND6 - Q6FIF0 |
| 6 | VIM - P08670 |
| 7 | CASP3 - P42574 |
| 8 | CDR2 - Q01850 |
| 9 | CD44 - P16070 |
| 10 | CDC25C - P30307 |
| 11 | NEUROD2 - Q15784 |
| 12 | ARHGAP26 - Q9UNA1 |
| 13 | MAPK14 - Q16539 |
| 14 | MAPK12 - P53778 |
| 15 | MAP2K3 - P46734 |
Regulation
Activation:
Kinase activity is activated upon binding to Rho proteins (RHOA, RHOB and RAC1). Activated by lipids, particularly cardiolipin and to a lesser extent by other acidic phospholipids. Activated by caspase-3 (CASP3) cleavage during apoptosis.Phosphorylation at Thr-774 (activation loop of the kinase domain) and Ser-916 (turn motif) increases phosphotransferase activity. Activated by limited proteolysis with trypsin.
Inhibition:
NA
Synthesis:
NA
Degradation:
NA
Known Upstream Kinases
For further details on these substrates click on the Substrate Short Name or UniProt ID. Phosphosite Location is hyperlinked to PhosphoNET
predictions.
Based on in vitro and/or in vivo phosphorylation data
| Kinase Short Name | UniProt ID (Human) | Phosphosite Location | Phosphosite Sequence | Effect of Phosphorylation |
|---|
Known Downstream Substrates
For further details on these substrates click on the Substrate Short Name or UniProt ID. Phosphosite Location is hyperlinked to PhosphoNET
predictions.
Based on in vitro and/or in vivo phosphorylation data
| Substrate Short Name | UniProt ID (Human) | Phosphosite Location | Phosphosite Sequence | Effect of Phosphorylation |
|---|
| H3.1 | P68431 | T11 | KQTARKSTGGKAPRK | |
| MARCKS | P29966 | S159 | KKKKKRFSFKKSFKL | |
| MARCKS | P29966 | S163 | KRFSFKKSFKLSGFS | |
| MARCKS | P29966 | S170 | SFKLSGFSFKKNKKE | |
| PKN1 (PRKCL1) | Q16512 | S374 | GLYSRSGSLSGRSSL | |
| PKN1 (PRKCL1) | Q16512 | S576 | DPPSSPSSLSSPIQE | |
| PKN1 (PRKCL1) | Q16512 | S577 | PAGLPSTSCSLSSPT | |
| PKN1 (PRKCL1) | Q16512 | S608 | LCSPLRKSPLTLEDF | |
| PKN1 (PRKCL1) | Q16512 | T531 | PNATGTGTFSPGASP | |
| PKN1 (PRKCL1) | Q16512 | T64 | ENLRRATTDLGRSLG | |
| PKN1 (PRKCL1) | Q16512 | T774 | GYGDRTSTFCGTPEF | + |
| PPP1R14A (CPI 17) | Q96A00 | T38 | QKRHARVTVKYDRRE | - |
| Tau | P10636 | S530 | GSRSRTPSLPTPPTR | |
| Tau | P10636 | S575 | PDLKNVKSKIGSTEN | |
| Tau | P10636 | S636 | VDLSKVTSKCGSLGN | |
| Tau | P10636 | S669 | DFKDRVQSKIGSLDN |
Protein Kinase Specificity
Matrix of observed frequency (%) of amino acids in aligned protein substrate phosphosites
Matrix Type:
Experimentally derived from alignment of 32 known protein substrate phosphosites.
Domain #:
1
Inhibitors
For further details on these inhibitors click on the Compound Name and enter it into DrugKiNET or click on the ID's
Based on in vitro and/or in vivo phosphorylation data
| Compound Name | KD, Ki or IC50 (nM) | PubChem ID | ChEMBL ID | PubMed ID |
|---|
Disease Linkage
General Disease Association:
Cancer
Specific Cancer Types:
Prostate cancer
Comments:
Stimulation of the PKN1 signalling cascade results in androgen receptor superactivation in human prostate cancer cells. PKN1 also represses Wnt signalling in human melanoma cells.
Gene Expression in Cancers:
TranscriptoNET (www.transcriptonet.ca) analysis with mRNA expression data retrieved from the National Center for Biotechnology Information's Gene Expression Omnibus (GEO) database, which was normalized against 60 abundantly and commonly found proteins, indicated altered expression for this protein kinase as shown here as the percent change from normal tissue controls (%CFC) as supported with the Student T-test in the following types of human cancers: Barrett's esophagus epithelial metaplasia (%CFC= +121, p<0.024); Bladder carcinomas (%CFC= +48, p<0.062); Breast epithelial cell carcinomas (%CFC= +74, p<0.046); Cervical cancer (%CFC= -65, p<0.002); Clear cell renal cell carcinomas (cRCC) (%CFC= +69, p<0.042); Prostate cancer (%CFC= +45, p<0.092); and Skin melanomas - malignant (%CFC= +353, p<0.0001). The COSMIC website notes an up-regulated expression score for PKN1 in diverse human cancers of 529, which is 1.2-fold of the average score of 462 for the human protein kinases. The down-regulated expression score of 25 for this protein kinase in human cancers was 0.4-fold of the average score of 60 for the human protein kinases.
Mutagenesis Experiments:
Insertional mutagenesis studies in mice support a role for this protein kinase in mouse cancer oncogenesis.
Mutation Rate in All Cancers:
Percent mutation rates per 100 amino acids length in human cancers: 0.06 % in 25447 diverse cancer specimens. This rate is only -18 % lower than the average rate of 0.075 % calculated for human protein kinases in general.
Mutation Rate in Specific Cancers:
Highest percent mutation rates per 100 amino acids length in human cancers: 0.34 % in 1294 large intestine cancers tested; 0.29 % in 589 stomach cancers tested; 0.26 % in 864 skin cancers tested; 0.21 % in 603 endometrium cancers tested; 0.09 % in 710 oesophagus cancers tested; 0.08 % in 1956 lung cancers tested; 0.08 % in 127 biliary tract cancers tested; 0.06 % in 942 upper aerodigestive tract cancers tested; 0.06 % in 891 ovary cancers tested; 0.05 % in 1512 liver cancers tested; 0.05 % in 1316 breast cancers tested.
Frequency of Mutated Sites:
None > 5 in 20,730 cancer specimens
Comments:
Only 5 deletions, 2 insertions and no complex mutations are noted on the COSMIC website.