
Nomenclature
Short Name:
SRPK1
Full Name:
SRPK1a protein kinase
Alias:
- EC 2.7.11.1
- SFRS protein kinase 1
- SFRSK1
- SRPK1a protein kinase
Classification
Type:
Protein-serine/threonine kinase
Group:
CMGC
Family:
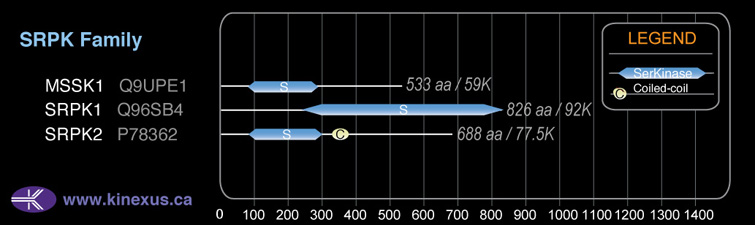
SRPK
SubFamily:
NA

Specific Links
Structure
Mol. Mass (Da):
74325
# Amino Acids:
655
# mRNA Isoforms:
3
mRNA Isoforms:
92,412 Da (826 AA; Q96SB4-3); 74,325 Da (655 AA; Q96SB4); 72,383 Da (639 AA; Q96SB4-4)
4D Structure:
Present in a seven component complex, the toposome, which separates entangled circular chromatin DNA during chromosome segregation. Interacts with HHV-1 ICP27 protein.
1D Structure:
3D Image (rendered using PV Viewer):
PDB ID
Subfamily Alignment
Domain Distribution:
| Start | End | Domain |
|---|---|---|
| 80 | 653 | Pkinase |
Kinexus Products
Click on entries below for direct links to relevant products from Kinexus for this protein kinase.
hiddentext
Post-translation Modifications
For detailed information on phosphorylation of this kinase go to PhosphoNET
Acetylated:
K4, K12, K13, K16, K585 (N6).
Serine phosphorylated:
S26, S33, S37, S51, S134, S222+, S249, S252, S309, S311, S333, S334, S555, S587, S726+.
Threonine phosphorylated:
T28, T253, T326, T373, T514.
Tyrosine phosphorylated:
Y62, Y117, Y365.
Ubiquitinated:
K4, K585, K604.
Distribution
Based on gene microarray analysis from the NCBI
Human Tissue Distribution
% Max Expression:
Mean Expression:
Number of Samples:
Standard Deviation:
% Max Expression:
Mean Expression:
Number of Samples:
Standard Deviation:
 41
41
1105
29
1275
 2
2
59
15
41
 29
29
780
17
641
 20
20
544
98
868
 31
31
834
25
577
 19
19
520
82
1178
 12
12
333
31
377
 44
44
1176
47
2266
 26
26
686
17
565
 9
9
240
90
411
 13
13
341
38
448
 26
26
689
180
637
 14
14
376
39
527
 3
3
88
12
56
 26
26
700
32
922
 3
3
75
15
19
 6
6
170
188
1169
 25
25
659
26
780
 14
14
368
92
612
 27
27
728
109
680
 13
13
360
30
767
 12
12
327
33
475
 22
22
578
27
655
 75
75
1998
26
2402
 20
20
547
30
659
 41
41
1109
62
1575
 18
18
483
42
716
 17
17
461
26
586
 18
18
469
26
517
 13
13
353
28
299
 36
36
955
24
763
 26
26
704
36
702
 7
7
197
72
394
 35
35
927
57
775
 100
100
2679
35
3022
Evolution
Species Conservation
PhosphoNET % Identity:
PhosphoNET % Similarity:
Homologene %
Identity:
PhosphoNET % Identity:
PhosphoNET % Similarity:
Homologene %
Identity:
 100
100
100
100 78.6
78.6
78.7
100 78.2
78.2
78.6
99 -
-
-
96 -
-
-
- 76.8
76.8
77.6
96.5 -
-
-
- 91.5
91.5
94.7
93 91.5
91.5
94
91.5 -
-
-
- 65.5
65.5
70.4
- 70.2
70.2
77.3
81 67.6
67.6
78.2
75 64.7
64.7
76.2
73 -
-
-
- -
-
-
52 -
-
-
- 23.1
23.1
37.2
46 -
-
-
- -
-
-
- -
-
-
- -
-
-
58 20.3
20.3
36
60 32.2
32.2
49.2
- -
-
-
-
For a wider analysis go to PhosphoNET Evolution in PhosphoNET
Binding Proteins
Examples of known interacting proteins
hiddentext
| No. | Name – UniProt ID |
|---|---|
| 1 | SNRNP70 - P08621 |
| 2 | SFRS6 - Q13247 |
| 3 | PRM1 - P04553 |
| 4 | SAFB - Q15424 |
| 5 | LUC7L3 - O95232 |
| 6 | SFRS2IP - Q99590 |
| 7 | FERMT1 - Q9BQL6 |
| 8 | TOP2A - P11388 |
| 9 | PRPF8 - Q6P2Q9 |
| 10 | RNPS1 - Q15287 |
| 11 | YWHAG - P61981 |
| 12 | LSM7 - Q9UK45 |
Regulation
Activation:
Activated by phosphorylation on Ser-51 and Ser-555.
Inhibition:
NA
Synthesis:
NA
Degradation:
NA
Known Upstream Kinases
For further details on these substrates click on the Substrate Short Name or UniProt ID. Phosphosite Location is hyperlinked to PhosphoNET
predictions.
Based on in vitro and/or in vivo phosphorylation data
| Kinase Short Name | UniProt ID (Human) | Phosphosite Location | Phosphosite Sequence | Effect of Phosphorylation |
|---|
Known Downstream Substrates
For further details on these substrates click on the Substrate Short Name or UniProt ID. Phosphosite Location is hyperlinked to PhosphoNET
predictions.
Based on in vitro and/or in vivo phosphorylation data
| Substrate Short Name | UniProt ID (Human) | Phosphosite Location | Phosphosite Sequence | Effect of Phosphorylation |
|---|
| RBM4 | Q9BWF3 | S309 | SYYGRDRSPLRRATA | |
| RBM8A | Q9Y5S9 | S166 | RRGGRRRSRSPDRRR | |
| RBM8A | Q9Y5S9 | S168 | GGRRRSRSPDRRRR_ | |
| SRSF1 (SF2, ASF) | Q07955 | S204 | RSPSYGRSRSRSRSR | |
| SRSF1 (SF2, ASF) | Q07955 | S206 | PSYGRSRSRSRSRSR | |
| SRSF1 (SF2, ASF) | Q07955 | S208 | YGRSRSRSRSRSRSR | |
| SRSF1 (SF2, ASF) | Q07955 | S210 | RSRSRSRSRSRSRSR | |
| SRSF1 (SF2, ASF) | Q07955 | S212 | RSRSRSRSRSRSRSN | |
| SRSF1 (SF2, ASF) | Q07955 | S214 | RSRSRSRSRSRSNSR | |
| SRSF1 (SF2, ASF) | Q07955 | S216 | RSRSRSRSRSNSRSR | |
| SRSF1 (SF2, ASF) | Q07955 | S218 | RSRSRSRSNSRSRSY | |
| SRSF1 (SF2, ASF) | Q07955 | S220 | RSRSRSNSRSRSYSP | |
| SRSF1 (SF2, ASF) | Q07955 | S222 | RSRSNSRSRSYSPRR | |
| SRSF1 (SF2, ASF) | Q07955 | S224 | RSNSRSRSYSPRRSR | |
| SRSF1 (SF2, ASF) | Q07955 | S226 | NSRSRSYSPRRSRGS |
Protein Kinase Specificity
Matrix of observed frequency (%) of amino acids in aligned protein substrate phosphosites
Matrix Type:
Experimentally derived from alignment of 15 known protein substrate phosphosites and 27 peptides phosphorylated by recombinant SRPK1 in vitro tested in-house by Kinexus.
Domain #:
1
Inhibitors
For further details on these inhibitors click on the Compound Name and enter it into DrugKiNET or click on the ID's
Based on in vitro and/or in vivo phosphorylation data
| Compound Name | KD, Ki or IC50 (nM) | PubChem ID | ChEMBL ID | PubMed ID |
|---|
Disease Linkage
Gene Expression in Cancers:
TranscriptoNET (www.transcriptonet.ca) analysis with mRNA expression data retrieved from the National Center for Biotechnology Information's Gene Expression Omnibus (GEO) database, which was normalized against 60 abundantly and commonly found proteins, indicated altered expression for this protein kinase as shown here as the percent change from normal tissue controls (%CFC) as supported with the Student T-test in the following types of human cancers: Bladder carcinomas (%CFC= +104, p<0.0001); Brain oligodendrogliomas (%CFC= +447, p<0.032); Cervical cancer (%CFC= +45, p<0.012); Classical Hodgkin lymphomas (%CFC= +70, p<0.008); Colon mucosal cell adenomas (%CFC= +75, p<0.0001); Large B-cell lymphomas (%CFC= +83, p<0.003); Lung adenocarcinomas (%CFC= +78, p<0.0002); Ovary adenocarcinomas (%CFC= +154, p<0.009); and Prostate cancer - metastatic (%CFC= +47, p<0.0001). The COSMIC website notes an up-regulated expression score for SRPK1 in diverse human cancers of 603, which is 1.3-fold of the average score of 462 for the human protein kinases. The down-regulated expression score of 44 for this protein kinase in human cancers was 0.7-fold of the average score of 60 for the human protein kinases.
Mutagenesis Experiments:
Insertional mutagenesis studies in mice have not yet revealed a role for this protein kinase in mouse cancer oncogenesis.
Mutation Rate in All Cancers:
Percent mutation rates per 100 amino acids length in human cancers: 0.06 % in 24751 diverse cancer specimens. This rate is only -24 % lower than the average rate of 0.075 % calculated for human protein kinases in general.
Mutation Rate in Specific Cancers:
Highest percent mutation rates per 100 amino acids length in human cancers: 0.35 % in 1270 large intestine cancers tested; 0.28 % in 603 endometrium cancers tested; 0.23 % in 864 skin cancers tested; 0.13 % in 589 stomach cancers tested; 0.13 % in 238 bone cancers tested; 0.1 % in 1634 lung cancers tested; 0.06 % in 1512 liver cancers tested; 0.05 % in 1276 kidney cancers tested.
Frequency of Mutated Sites:
Most frequent mutations with the number of reports indicated in brackets: G248R (3).
Comments:
Only 5 deletions, 1 insertion, and no complex mutations are noted on the COSMIC website.