
Nomenclature
Short Name:
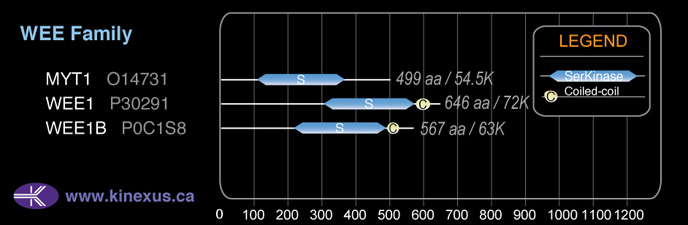
MYT1
Full Name:
Membrane-associated tyrosine-and threonine-specific cdc2-inhibitory kinase
Alias:
- MYT1 kinase
- PKMYT1
Classification
Type:
Protein-serine/threonine kinase
Group:
Other
Family:
WEE
SubFamily:
NA

Specific Links
Structure
Mol. Mass (Da):
54,521
# Amino Acids:
499
# mRNA Isoforms:
4
mRNA Isoforms:
54,521 Da (499 AA; Q99640); 53,542 Da (490 AA; Q99640-3); 52,146 Da (480 AA; Q99640-2); 47,284 Da (430 AA; Q99640-4)
4D Structure:
Interacts with CDC2-CCNB1 complex. Can also interact with PIN1 when phosphorylated by CDC2-CCNB1.
1D Structure:
3D Image (rendered using PV Viewer):
PDB ID
Subfamily Alignment
Domain Distribution:
| Start | End | Domain |
|---|---|---|
| 110 | 359 | Pkinase |
| 382 | 398 | Membrane-association |
| 398 | 499 | PIN1_interaction |
| 437 | 499 | CDC2-CCNB1 interaction |
Kinexus Products
Click on entries below for direct links to relevant products from Kinexus for this protein kinase.
hiddentext
Post-translation Modifications
For detailed information on phosphorylation of this kinase go to PhosphoNET
Serine phosphorylated:
S40, S48, S50-, S60, S64, S75, S83-, S89, S94, S109, S120, S141, S143, S160, S416, S426-, S435, S441, S454, S458, S469, S473, S479, S482.
Threonine phosphorylated:
T17, T24, T71, T412, T453, T455, T461, T495-.
Tyrosine phosphorylated:
Y97, Y136.
Ubiquitinated:
K126, K149, K154, K163.
Distribution
Based on gene microarray analysis from the NCBI
Human Tissue Distribution
% Max Expression:
Mean Expression:
Number of Samples:
Standard Deviation:
% Max Expression:
Mean Expression:
Number of Samples:
Standard Deviation:
 23
23
962
16
1307
 3
3
115
12
93
 1.3
1.3
54
6
33
 15
15
638
107
1121
 14
14
607
14
588
 7
7
288
45
561
 18
18
763
27
825
 39
39
1650
33
3551
 5
5
231
10
182
 9
9
381
77
419
 23
23
971
62
2508
 11
11
460
144
623
 1.4
1.4
57
19
36
 2
2
95
12
66
 5
5
200
17
194
 2
2
69
9
48
 6
6
240
276
2249
 3
3
137
19
190
 19
19
812
110
2130
 9
9
400
56
432
 2
2
103
23
95
 3
3
113
24
112
 3
3
121
16
98
 36
36
1497
65
2594
 3
3
138
23
133
 49
49
2085
37
4785
 2
2
65
22
46
 3
3
128
17
107
 2
2
71
16
53
 8
8
319
14
89
 8
8
339
18
225
 100
100
4214
27
4770
 38
38
1590
57
1529
 18
18
752
31
738
 1.3
1.3
55
22
53
Evolution
Species Conservation
PhosphoNET % Identity:
PhosphoNET % Similarity:
Homologene %
Identity:
PhosphoNET % Identity:
PhosphoNET % Similarity:
Homologene %
Identity:
 100
100
100
100 99.5
99.5
99.8
100 -
-
-
- -
-
-
91 -
-
-
- 56.7
56.7
58.7
91 -
-
-
- 87.5
87.5
90.9
89 88.1
88.1
91.5
90 -
-
-
- 69.9
69.9
77.3
- -
-
-
- 48.5
48.5
62.7
52 39.3
39.3
52.8
49 -
-
-
- 32.6
32.6
49.5
- -
-
-
- 29.3
29.3
43.5
- -
-
-
- -
-
-
- -
-
-
- -
-
-
- -
-
-
- -
-
-
- -
-
-
-
For a wider analysis go to PhosphoNET Evolution in PhosphoNET
Regulation
Activation:
NA
Inhibition:
Negatively regulated by hyperphosphorylation during mitosis.
Synthesis:
NA
Degradation:
NA
Known Upstream Kinases
For further details on these substrates click on the Substrate Short Name or UniProt ID. Phosphosite Location is hyperlinked to PhosphoNET
predictions.
Based on in vitro and/or in vivo phosphorylation data
| Kinase Short Name | UniProt ID (Human) | Phosphosite Location | Phosphosite Sequence | Effect of Phosphorylation |
|---|
Known Downstream Substrates
For further details on these substrates click on the Substrate Short Name or UniProt ID. Phosphosite Location is hyperlinked to PhosphoNET
predictions.
Based on in vitro and/or in vivo phosphorylation data
| Substrate Short Name | UniProt ID (Human) | Phosphosite Location | Phosphosite Sequence | Effect of Phosphorylation |
|---|
| CDK1 (CDC2) | P06493 | T14 | IEKIGEGTYGVVYKG | - |
| CDK1 (CDC2) | P06493 | Y15 | EKIGEGTYGVVYKGR | - |
Protein Kinase Specificity
Matrix of observed frequency (%) of amino acids in aligned protein substrate phosphosites
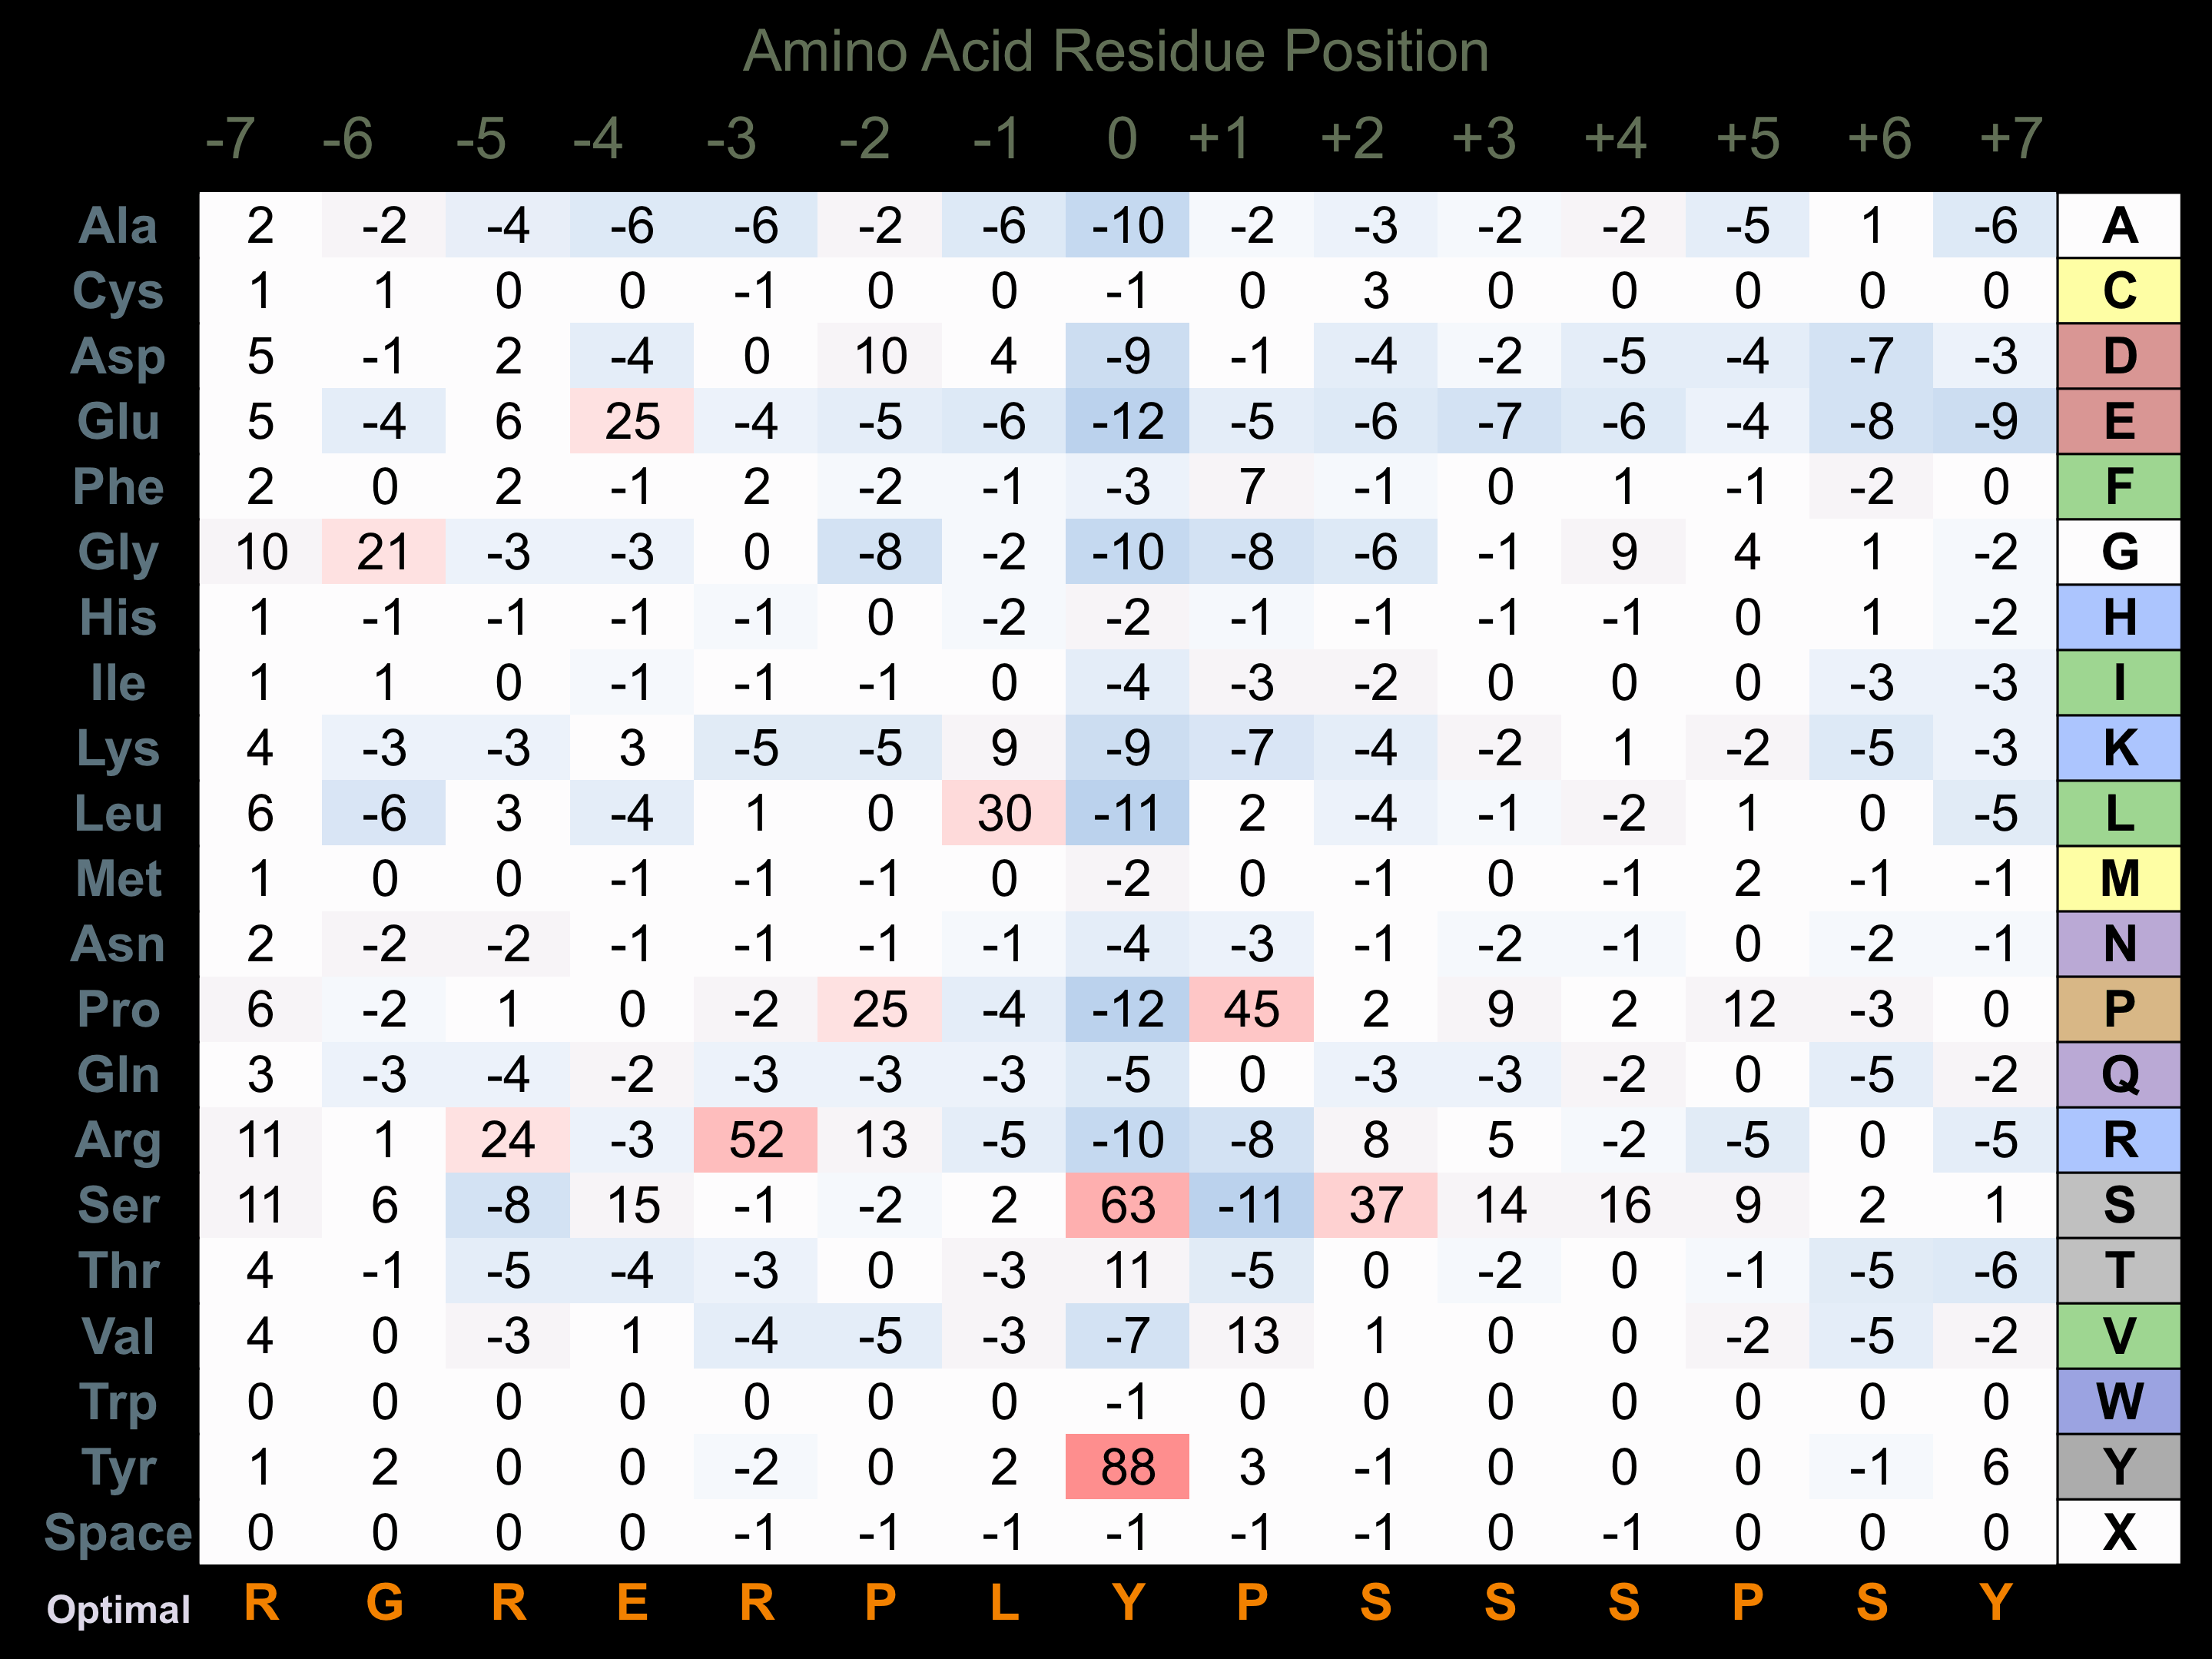
Matrix Type:
Predicted from the application of the Kinexus Kinase Substrate Predictor Version 2.0 algorithm, which was trained with over 10,000 kinase-protein substrate pairs and 8,000 kinase-peptide substrate pairs.
Domain #:
1
Inhibitors
For further details on these inhibitors click on the Compound Name and enter it into DrugKiNET or click on the ID's
Based on in vitro and/or in vivo phosphorylation data
| Compound Name | KD, Ki or IC50 (nM) | PubChem ID | ChEMBL ID | PubMed ID |
|---|
| PD173955 | Kd = 44 nM | 447077 | 386051 | 22037378 |
| Dasatinib | Kd = 130 nM | 11153014 | 1421 | 18183025 |
| Bosutinib | Kd = 350 nM | 5328940 | 288441 | 22037378 |
| MK1775 | IC50 > 500 nM | 24856436 | 19887545 | |
| Pelitinib | Kd = 930 nM | 6445562 | 607707 | 15711537 |
| WZ3146 | Kd > 1 µM | 44607360 | 20033049 | |
| WZ4002 | Kd > 1 µM | 44607530 | 20033049 | |
| CHEMBL249097 | Kd < 1.25 µM | 25138012 | 249097 | 19035792 |
| BMS-690514 | Kd < 4.5 µM | 11349170 | 21531814 |
Disease Linkage
General Disease Association:
Cancer, neurological disorders
Specific Diseases (Non-cancerous):
Leukomalacia; Periventricular leukomalacia (PVL)
Comments:
Leukomalacia is related to the rare disorder Periventricular Leukomalacia (PVL) which is a neurological disorder involving the necrosis or coagulation of the white-matter of the brain. PVL will often occur in newborns or premature infants and it will often progress into epilepsy or cerebral palsy.
Specific Cancer Types:
Dysembryoplastic neuroepithelial tumours (DNT, DNET)
Comments:
MYT1 is linked to Dysembryoplastic Neuroepithelial tumours (DNT, DNET), which are rare brain tumours that often affect the temporal lobe or the caudate nucleus. DNT is often benign, but can lead to epilepsy.
Gene Expression in Cancers:
TranscriptoNET (www.transcriptonet.ca) analysis with mRNA expression data retrieved from the National Center for Biotechnology Information's Gene Expression Omnibus (GEO) database, which was normalized against 60 abundantly and commonly found proteins, indicated altered expression for this protein kinase as shown here as the percent change from normal tissue controls (%CFC) as supported with the Student T-test in the following types of human cancers: Brain glioblastomas (%CFC= +475, p<0.0002); Brain oligodendrogliomas (%CFC= +456, p<0.004); Breast epithelial carcinomas (%CFC= +65, p<0.07); Cervical epithelial cancer (%CFC= +45, p<0.047); Cervical cancer stage 1B (%CFC= +74, p<0.056); Cervical cancer stage 2A (%CFC= +150, p<0.0006); Classical Hodgkin lymphomas (%CFC= +49, p<0.0002); Colon mucosal cell adenomas (%CFC= +76, p<0.0001); Large B-cell lymphomas (%CFC= +67, p<0.0002); Oral squamous cell carcinomas (OSCC) (%CFC= +125, p<0.0009); Ovary adenocarcinomas (%CFC= +183, p<0.049); Pituitary adenomas (aldosterone-secreting) (%CFC= +91, p<0.005); Skin melanomas - malignant (%CFC= +154, p<0.0001); Uterine leiomyomas (%CFC= +187, p<0.031); and Vulvar intraepithelial neoplasia (%CFC= +174, p<0.004). The COSMIC website notes an up-regulated expression score for MYT1 in diverse human cancers of 536, which is 1.2-fold of the average score of 462 for the human protein kinases. The down-regulated expression score of 1 for this protein kinase in human cancers was 100% lower than average score of 60 for the human protein kinases.
Mutagenesis Experiments:
Insertional mutagenesis studies in mice have not yet revealed a role for this protein kinase in mouse cancer oncogenesis. MYT1 kinase phosphotransferase activity can be abrogated with either a N238A or a D251A mutation. The interaction of MYT1 with CDC2-CCNB1 can be lost with the R486A + N487A + L488A mutations.
Mutation Rate in All Cancers:
Percent mutation rates per 100 amino acids length in human cancers: 0.04 % in 25158 diverse cancer specimens. This rate is -46 % lower than the average rate of 0.075 % calculated for human protein kinases in general.
Mutation Rate in Specific Cancers:
Highest percent mutation rates per 100 amino acids length in human cancers: 0.93 % in 864 skin cancers tested; 0.9 % in 555 stomach cancers tested; 0.89 % in 1240 large intestine cancers tested; 0.53 % in 603 endometrium cancers tested; 0.37 % in 548 urinary tract cancers tested; 0.32 % in 1799 lung cancers tested; 0.29 % in 273 cervix cancers tested; 0.28 % in 710 oesophagus cancers tested; 0.25 % in 238 bone cancers tested; 0.22 % in 1300 breast cancers tested; 0.17 % in 1512 liver cancers tested; 0.15 % in 807 ovary cancers tested; 0.13 % in 949 upper aerodigestive tract cancers tested; 0.12 % in 1459 pancreas cancers tested; 0.1 % in 382 soft tissue cancers tested; 0.09 % in 881 prostate cancers tested; 0.09 % in 1341 kidney cancers tested; 0.07 % in 558 thyroid cancers tested; 0.07 % in 2074 central nervous system cancers tested; 0.02 % in 1982 haematopoietic and lymphoid cancers tested.
Frequency of Mutated Sites:
None > 7 in 20,058 cancer specimens
Comments:
Only 1 deletion and 1 insertion and no complex mutations are noted on the COSMIC website.