
Nomenclature
Short Name:
BARK1
Full Name:
Beta-adrenergic receptor kinase 1
Alias:
- ADRBK1
- Adrenergic, beta, receptor kinase 1
- Beta-ARK-1
- EC 2.7.11.15
- FLJ16718
- G-protein coupled receptor kinase 2; Kinase GRK2
- ARBK1
- BARK
- BARK1
- Beta-adrenergic receptor kinase 1
Classification
Type:
Protein-serine/threonine kinase
Group:
AGC
Family:
GRK
SubFamily:
BARK

Specific Links
Structure
Mol. Mass (Da):
79574
# Amino Acids:
689
# mRNA Isoforms:
1
mRNA Isoforms:
79,574 Da (689 AA; P25098)
4D Structure:
Interacts with GIT1 By similarity. Interacts with, and phosphorylates chemokine-stimulated CCR5. Interacts with ARRB1. Interacts with LPAR1 and LPAR2. Interacts with RALA in response to LPAR1 activation. ADRBK1 and RALA mutually inhibit each others binding to LPAR1
3D Structure:
1D Structure:
3D Image (rendered using PV Viewer):
PDB ID
Subfamily Alignment
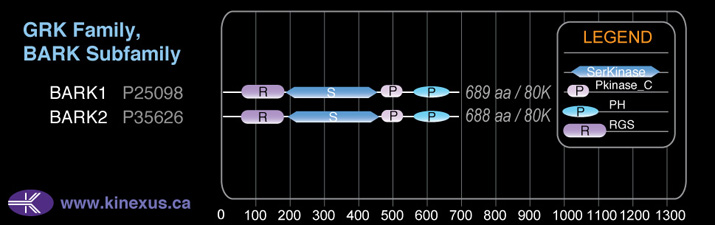
Domain Distribution:
Kinexus Products
Click on entries below for direct links to relevant products from Kinexus for this protein kinase.
hiddentext
Post-translation Modifications
For detailed information on phosphorylation of this kinase go to PhosphoNET
Acetylated:
K644.
Serine phosphorylated:
S29+, S247, S350+, S416, S423, S670-, S676, S685.
Threonine phosphorylated:
T54, T248, T263, T353+.
Tyrosine phosphorylated:
Y13+, Y86-, Y92+, Y206, Y356-, Y506.
Ubiquitinated:
K57, K62, K170, K344, K345, K628, K677.
Distribution
Based on gene microarray analysis from the NCBI
Human Tissue Distribution
% Max Expression:
Mean Expression:
Number of Samples:
Standard Deviation:
% Max Expression:
Mean Expression:
Number of Samples:
Standard Deviation:
 64
64
1096
45
1417
 10
10
172
20
234
 8
8
143
22
190
 24
24
406
135
519
 47
47
804
34
537
 3
3
45
111
53
 13
13
217
43
526
 54
54
935
59
1407
 23
23
398
24
339
 10
10
171
120
273
 8
8
145
47
144
 49
49
836
229
711
 15
15
251
55
296
 11
11
183
15
177
 16
16
276
38
315
 6
6
98
22
119
 16
16
281
139
181
 18
18
313
33
402
 9
9
156
134
346
 26
26
455
162
505
 12
12
200
35
171
 19
19
335
41
326
 11
11
197
33
265
 11
11
193
33
347
 17
17
292
35
232
 46
46
797
84
1244
 22
22
371
58
1196
 18
18
306
33
407
 11
11
181
33
196
 39
39
673
42
900
 18
18
305
30
211
 100
100
1721
51
2743
 11
11
189
85
610
 48
48
823
83
765
 18
18
304
48
318
Evolution
Species Conservation
PhosphoNET % Identity:
PhosphoNET % Similarity:
Homologene %
Identity:
PhosphoNET % Identity:
PhosphoNET % Similarity:
Homologene %
Identity:
 100
100
100
100 97.1
97.1
97.1
100 86.6
86.6
87.9
100 -
-
-
98 -
-
-
98 98.5
98.5
99.6
98.5 -
-
-
- 98.8
98.8
99.7
99 98.4
98.4
99.3
98 -
-
-
- -
-
-
- -
-
-
92 -
-
-
- -
-
-
- -
-
-
- 64.9
64.9
78.3
68 68.9
68.9
80.7
- 63.9
63.9
79.8
65 -
-
-
- -
-
-
- -
-
-
- -
-
-
- -
-
-
- -
-
-
- -
-
-
-
For a wider analysis go to PhosphoNET Evolution in PhosphoNET
Binding Proteins
Examples of known interacting proteins
hiddentext
| No. | Name – UniProt ID |
|---|---|
| 1 | GIT1 - Q9Y2X7 |
| 2 | PRKCB - P05771 |
| 3 | AGTR1 - P30556 |
| 4 | PDC - P20941 |
| 5 | CAPN2 - P17655 |
| 6 | MC4R - P32245 |
| 7 | CCR4 - P51679 |
| 8 | PRKACA - P17612 |
| 9 | RPS27A - P62988 |
| 10 | RHOD - O00212 |
| 11 | PIK3CG - P48736 |
| 12 | FPR1 - P21462 |
| 13 | OPRD1 - P41143 |
| 14 | RPLP2 - P05387 |
| 15 | MDM2 - Q00987 |
Regulation
Activation:
Activated by Gbeta/gamma subunit complex. Phosphorylation of Ser-29 increases phosphotransferase activity.
Inhibition:
Phosphorylation of Ser-670 inhibits Gbeta/gamma-mediated activation of GRK2. Phosphorylation of Tyr-13, Tyr-86, Tyr-92 and Ser-685 induces interaction with G-alpha(q) and may induce protein degradation.
Synthesis:
NA
Degradation:
NA
Known Upstream Kinases
For further details on these substrates click on the Substrate Short Name or UniProt ID. Phosphosite Location is hyperlinked to PhosphoNET
predictions.
Based on in vitro and/or in vivo phosphorylation data
| Kinase Short Name | UniProt ID (Human) | Phosphosite Location | Phosphosite Sequence | Effect of Phosphorylation |
|---|
| EGFR | P00533 | Y13 | AVLADVSYLMAMEKS | + |
| SRC | P12931 | Y13 | AVLADVSYLMAMEKS | + |
| PKCa | P17252 | S29 | ATPAARASKKILLPE | + |
| PKCg | P05129 | S29 | ATPAARASKKILLPE | + |
| PKCd | Q05655 | S29 | ATPAARASKKILLPE | + |
| EGFR | P00533 | Y86 | ARPLVEFYEEIKKYE | - |
| SRC | P12931 | Y86 | ARPLVEFYEEIKKYE | - |
| EGFR | P00533 | Y92 | FYEEIKKYEKLETEE | + |
| SRC | P12931 | Y92 | FYEEIKKYEKLETEE | + |
| ERK1 | P27361 | S670 | KMKNKPRSPVVELSK | - |
| PKACa | P17612 | S685 | VPLVQRGSANGL___ |
Known Downstream Substrates
For further details on these substrates click on the Substrate Short Name or UniProt ID. Phosphosite Location is hyperlinked to PhosphoNET
predictions.
Based on in vitro and/or in vivo phosphorylation data
| Substrate Short Name | UniProt ID (Human) | Phosphosite Location | Phosphosite Sequence | Effect of Phosphorylation |
|---|
| ADRA1B | P35368 | S405 | RSQSRKDSLDDSGSC | |
| ADRA1B | P35368 | S409 | RKDSLDDSGSCLSGS | |
| ADRA1B | P35368 | S411 | DSLDDSGSCLSGSQR | |
| ADRA2A | P08913 | S296 | DALDLEESSSSDHAE | |
| ADRA2A | P08913 | S297 | ALDLEESSSSDHAER | |
| ADRA2A | P08913 | S298 | LDLEESSSSDHAERP | |
| ADRA2A | P08913 | S299 | DLEESSSSDHAERPP | |
| ADRB2 | P07550 | S355 | KAYGNGYSSNGNTGE | |
| ADRB2 | P07550 | S356 | AYGNGYSSNGNTGEQ | |
| ADRB2 | P07550 | S396 | GHQGTVPSDNIDSQG | |
| ADRB2 | P07550 | S401 | VPSDNIDSQGRNCST | |
| ADRB2 | P07550 | S407 | DSQGRNCSTNDSLL_ | |
| ADRB2 | P07550 | T384 | LCEDLPGTEDFVGHQ | |
| Calsenilin | Q9Y2W7 | S95 | FTKKELQSLYRGFKN | |
| DOR1 | P41143 | S363 | RVTACTPSDGPGGGA | |
| DOR1 | P41143 | T358 | ATARERVTACTPSDG | |
| ENaC beta | P51168 | S633 | QPLDVIESDSEGDAI | |
| Ezrin | P15311 | T567 | QGRDKYKTLRQIRQG | |
| GnRHR2 | Q96P88 | S251 | HQELSIDSSKEGSGR | |
| GnRHR2 | Q96P88 | S252 | QELSIDSSKEGSGRM | |
| H1R | P35367 | S398 | WKRLRSHSRQYVSGL | |
| IRS1 | P35568 | S616 | DDGYMPMSPGVAPVP | - |
| IRS1 | P35568 | S639 | YMPMSPKSVSAPQQI | - |
| MC4R | P32245 | S329 | LGGLCDLSSRY____ | |
| MC4R | P32245 | S330 | GGLCDLSSRY_____ | |
| p38a MAPK (MAPK14) | Q16539 | T123 | IVKCQKLTDDHVQFL | - |
| PDE6G | P18545 | T62 | PGMEGLGTDITVICP | |
| PDGFRB | P09619 | S1104 | PRAEAEDSFL_____ | - |
| RPLP2 | P05387 | S102 | KDEKKEESEESDDDM | |
| RPLP2 | P05387 | S105 | KKEESEESDDDMGFG | |
| Smad2 | Q15796 | T197 | LPPLDDYTHSIPENT | |
| SNCA | P37840 | S129 | NEAYEMPSEEGYQDY | |
| SNCB | Q16143 | S118 | LMEPEGESYEDPPQE | |
| SSTR2 | P30874 | S341 | GTDDGERSDSKQDKS | |
| SSTR2 | P30874 | S343 | DDGERSDSKQDKSRL | |
| TBXA2R | P21731 | S239 | AQQRPRDSEVEMMAQ | |
| TBXA2R iso2 | P21731-2 | S357 | RLPGSSDSRASASRA | |
| TRHR | P34981 | T365 | KESDHFSTELDDITV | |
| TUBB | P07437 | S420 | SNMNDLVSEYQQYQD | |
| TUBB | P07437 | T409 | GMDEMEFTEAESNMN | |
| TUBB3 | Q13509 | S444 | YEDDEEESEAQGPK |
Protein Kinase Specificity
Matrix of observed frequency (%) of amino acids in aligned protein substrate phosphosites
Matrix Type:
Experimentally derived from alignment of 80 known protein substrate phosphosites.
Domain #:
1
Inhibitors
For further details on these inhibitors click on the Compound Name and enter it into DrugKiNET or click on the ID's
Based on in vitro and/or in vivo phosphorylation data
| Compound Name | KD, Ki or IC50 (nM) | PubChem ID | ChEMBL ID | PubMed ID |
|---|
| Ophiocordin | IC50 = 42 nM | 5287736 | 60254 | 20128603 |
| Staurosporine | IC50 = 500 nM | 5279 | 22037377 | |
| AGL2043 | IC50 = 1.6102 µM | 9817165 | 22037377 | |
| Momelotinib | IC50 > 2 µM | 25062766 | 19295546 |
Disease Linkage
General Disease Association:
Neurological disorders
Specific Diseases (Non-cancerous):
Alzheimer's disease (AD)
Comments:
Alzheimer's disease (AD) is a neurodegenerative disease that causes progressive loss of memory, judgement, and other cognitive processes. The hallmark of AD pathology is the deposition of beta-amyloid plaques and tau tangles. These abnormalities are implicated in the disruption of cellular communication, oxidative cell damage, and eventual cell death. Multiple genes are thought to contribute to AD suceptibility along with epigenetic and environmental factors. BARK1 (GRK2, ADRBK1) is a protein-serine/threonine kinase that can phosphorylate and desensitize the activated form of the beta-adrenergic receptor. BARK1 is a member of the GRKs, which function to phosphorylate GPCRs. Abnormal BARK1 expression has been implicated in AD and after cerebral hypoxia/ischemia. Moreover, GRKs have been shown to regulate the expression and function of the metabotropic glutamate receptor 5, which has been implicated in the pathogenesis of AD. Elevated BARK1 expression has been demonstrated in the early stages of nervous tissue damage in human AD patients and animal models of AD. Furthermore, in AD nervous tissue BARK1 expression is associated with damaged cellular constituents such as mitochondria and mitochondrial-derived lysosomes. In addition, elevated BARK1 expression is observed in damaged blood vessels and vascular cells in AD patients and has been observed in neurons that contain neurofibrillary tangles (NFT). Later stages of the disease display the significant down regulation of BARK1 expression, indicating that the kinase may play a role only in the early stages of AD pathogenesis.
Gene Expression in Cancers:
TranscriptoNET (www.transcriptonet.ca) analysis with mRNA expression data retrieved from the National Center for Biotechnology Information's Gene Expression Omnibus (GEO) database, which was normalized against 60 abundantly and commonly found proteins, indicated altered expression for this protein kinase as shown here as the percent change from normal tissue controls (%CFC) as supported with the Student T-test in the following types of human cancers: Bladder carcinomas (%CFC= -57, p<0.018); Brain glioblastomas (%CFC= +1376, p<0.0004); Brain oligodendrogliomas (%CFC= +3026, p<0.03); and Ovary adenocarcinomas (%CFC= +138, p<0.016). The COSMIC website notes an up-regulated expression score for BARK1 in diverse human cancers of 523, which is 1.1-fold of the average score of 462 for the human protein kinases. The down-regulated expression score of 62 for this protein kinase in human cancers was 1-fold of the average score of 60 for the human protein kinases.
Mutagenesis Experiments:
Insertional mutagenesis studies in mice have not yet revealed a role for this protein kinase in mouse cancer oncogenesis.
Mutation Rate in All Cancers:
Percent mutation rates per 100 amino acids length in human cancers: 0.06 % in 24916 diverse cancer specimens. This rate is only -19 % lower than the average rate of 0.075 % calculated for human protein kinases in general.
Mutation Rate in Specific Cancers:
Highest percent mutation rates per 100 amino acids length in human cancers: 0.25 % in 589 stomach cancers tested; 0.25 % in 1270 large intestine cancers tested; 0.24 % in 603 endometrium cancers tested; 0.17 % in 864 skin cancers tested; 0.13 % in 548 urinary tract cancers tested; 0.08 % in 1512 liver cancers tested; 0.07 % in 881 prostate cancers tested; 0.06 % in 1824 lung cancers tested; 0.06 % in 1316 breast cancers tested; 0.03 % in 2082 central nervous system cancers tested.
Frequency of Mutated Sites:
None > 7 in 20,199 cancer specimens
Comments:
Only 8 deletions, no insertions mutations or complex mutations are noted on the COSMIC website.