• KinATLAS
  • TranscriptoNET
  • PhosphoNET
  • OncoNET
  • KinaseNET
  • DrugKiNET
  • DrugProNET
  • KiNET-AM
  • Kinetica Online

Updated November 2019

Home | Kinexus | Contact | Credits

Nomenclature

Short Name:
YES
Full Name:
Proto-oncogene tyrosine-protein kinase Yes
Alias:
  • c-Yes
  • EC 2.7.10.2
  • HsT441
  • p61-Yes

Classification

Type:
Protein-tyrosine kinase
Group:
TK
Family:
Src
SubFamily:
NA


Specific Links

Entrez-Gene Entry: 7525
Entrez-Protein Entry: NP_005424
GeneCards Entry: C-YES
KinBASE Entry: YES
OMIM Entry: 164880
Pfam Entry: P07947
PhosphoNET Entry: P07947
Phosphosite Plus Entry: 833
Protein Data Bank Entry: 2HDA
ScanSite Entry: P07947
Source Entry: YES1
UCSD-Nature Entry: A002394
UniProt Entry: P07947
Kinexus Products: YES
Yamaguchi sarcoma proto-oncogene-encoded tyrosine kinase Y222+Y223 phosphosite-specific antibody AB-PK858
Yamaguchi sarcoma proto-oncogene-encoded tyrosine kinase (N219-T226, human) pY222+pY223 phosphopeptide - Powder PE-04AHY99

General Links

ClustalW2
GPS-Cuckoo
Human Protein Atlas
Kinase.com
Kinase Research
Kinasource
Kinomer
Netphorest
NetworKIN
Phosida
PhosphoElm
Protein Blast
ScanSite
String

Structure

Mol. Mass (Da):
60801
# Amino Acids:
543
# mRNA Isoforms:
1
mRNA Isoforms:
60,801 Da (543 AA; P07947)
4D Structure:
NA
1D Structure:
Retrieve Gene Sequence
Retrieve Full Protein Sequence
Retrieve Catalytic Domain Sequence
 
Subfamily Alignment
subfamily domain
 
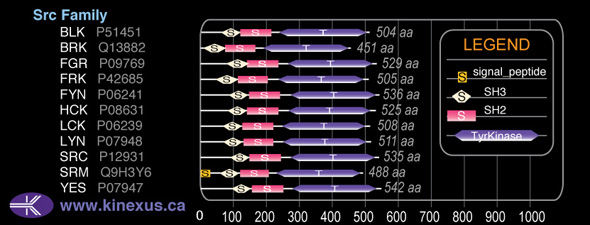
Domain Distribution:
Start End Domain
91 152 SH3
158 255 SH2
276 525 TyrKc
277 528 Pkinase
 

Kinexus Products

Click on entries below for direct links to relevant products from Kinexus for this protein kinase.
hiddentext
○ Yamaguchi sarcoma proto-oncogene-encoded tyrosine kinase Y222+Y223 phosphosite-specific antibody AB-PK858
○ Yamaguchi sarcoma proto-oncogene-encoded tyrosine kinase (N219-T226, human) pY222+pY223 phosphopeptide - Powder PE-04AHY99
 

Post-translation Modifications

For detailed information on phosphorylation of this kinase go to PhosphoNET
Palmitoylated:
C3 (predicted).
Serine phosphorylated:

S11, S26, S28, S30, S40, S45, S46, S111, S144, S187, S195, S197, S276, S355.
Myristoylated:
G2.
Threonine phosphorylated:

T21, T37, T38, T190, T225, T226, T427+, T531, T533.
Tyrosine phosphorylated:

Y16, Y31, Y32, Y100, Y141, Y146, Y159, Y194, Y222, Y223, Y336, Y345, Y426+, Y446, Y489, Y537-.
Ubiquitinated:
K191, K235, K437.
 

Distribution

Based on gene microarray analysis from the NCBI
Human Tissue Distribution
% Max Expression:

Mean Expression:

Number of Samples:

Standard Deviation:
% Max Expression:

Mean Expression:

Number of Samples:

Standard Deviation:
  • adipose
    73

    799

    42

    868

  • adrenal
    7

    79

    23

    54

  • bladder
    49

    538

    13

    503

  • brain
    42

    464

    134

    699

  • breast
    80

    878

    39

    745

  • cervix
    17

    183

    130

    240

  • colon
    30

    332

    46

    426

  • heart
    96

    1052

    62

    1510

  • intestine
    68

    746

    27

    650

  • kidney
    20

    213

    114

    363

  • liver
    37

    406

    41

    525

  • lung
    68

    747

    234

    699

  • lymphnode
    17

    181

    46

    367

  • ovary
    14

    157

    18

    146

  • pancreas
    40

    440

    32

    529

  • pituitary
    13

    145

    22

    135

  • prostate
    14

    153

    137

    263

  • salivarygland
    41

    451

    27

    651

  • skeletalmuscle"
    8

    90

    131

    137

  • skin
    63

    685

    165

    749

  • spinalcord
    38

    418

    29

    646

  • spleen
    44

    483

    35

    663

  • stomach
    44

    482

    24

    588

  • testis
    37

    404

    27

    484

  • thymus
    21

    226

    29

    379

  • thyroid
    100

    1092

    87

    2432

  • tonsil
    15

    162

    52

    296

  • trachea
    28

    301

    27

    434

  • uterus
    36

    388

    27

    516

  • reticulocytes"
    4

    46

    42

    45

  • t-lymphocytes
    46

    504

    30

    565

  • b-lymphocytes
    42

    461

    45

    388

  • neutrophils
    32

    352

    86

    646

  • macrophages
    68

    743

    83

    690

  • sperm
    12

    127

    48

    176


Evolution

Species Conservation
PhosphoNET % Identity:
PhosphoNET % Similarity:
Homologene %
Identity:
PhosphoNET % Identity:
PhosphoNET % Similarity:
Homologene %
Identity:
  • tableheader
    100

    100

    100
  • tableheader
    94.2

    94.2

    100
  • tableheader
    99.6

    99.8

    100
  • tableheader
    -

    -

    97
  • tableheader
    -

    -

    100
  • tableheader
    97.6

    97.9

    98
  • tableheader
    -

    -

    -
  • tableheader
    95.9

    97

    96
  • tableheader
    73.6

    83.2

    95
  • tableheader
    -

    -

    -
  • tableheader
    81.4

    82.6

    -
  • tableheader
    91.9

    96.3

    92
  • tableheader
    89.6

    93.7

    91
  • tableheader
    85.9

    91.3

    86
  • tableheader
    -

    -

    -
  • tableheader
    54.3

    67.2

    -
  • tableheader
    -

    -

    -
  • tableheader
    -

    -

    -
  • tableheader
    -

    -

    -
  • tableheader
    -

    -

    -
  • tableheader
    -

    -

    -
  • tableheader
    -

    -

    -
  • tableheader
    -

    -

    -
  • tableheader
    -

    -

    -
  • tableheader
    -

    -

    -
For a wider analysis go to PhosphoNET Evolution in PhosphoNET
 

Binding Proteins

Examples of known interacting proteins
hiddentext
No. Name – UniProt ID
1 PRODH2 - Q9UF12
2 NPHS1 - O60500
3 CD36 - P16671
4 FLT1 - P17948
5 OCLN - Q16625
6 ITGB4 - P16144
7 PTPRE - P23469
8 FAS - P25445
9 PDGFRB - P09619
10 CDKN1B - P46527
11 SLC9A3R1 - O14745
12 CD46 - P15529
13 MST1R - Q04912
14 TRPV4 - Q9HBA0
15 GP6 - Q9HCN6
 

Regulation

Activation:
Phosphorylation of Tyr-537 increases phosphoransferase activity.
Inhibition:
NA
Synthesis:
NA
Degradation:
NA
 

Kinections Map

Click here to download a PPT of the image below
 
Kinections GIF
 

Known Upstream Kinases

For further details on these substrates click on the Substrate Short Name or UniProt ID. Phosphosite Location is hyperlinked to PhosphoNET predictions.
Based on in vitro and/or in vivo phosphorylation data

Kinase Short Name UniProt ID (Human) Phosphosite Location Phosphosite Sequence Effect of Phosphorylation
YES P07947 Y31 VSTSVSHYGAEPTTV
YES P07947 Y426 RLIEDNEYTARQGAK +
CSK P41240 Y537 FTATEPQYQPGENL_ -
 

Known Downstream Substrates

For further details on these substrates click on the Substrate Short Name or UniProt ID. Phosphosite Location is hyperlinked to PhosphoNET predictions.
Based on in vitro and/or in vivo phosphorylation data

Substrate Short Name UniProt ID (Human) Phosphosite Location Phosphosite Sequence Effect of Phosphorylation
Cbl P22681 Y700 EGEEDTEYMTPSSRP
Cbl P22681 Y731 QQIDSCTYEAMYNIQ
Cbl P22681 Y774 SENEDDGYDVPKPPV
CDK4 P11802 Y17 AEIGVGAYGTVYKAR -
p27Kip1 P46527 Y74 HKPLEGKYEWQEVEK ?
p27Kip1 P46527 Y88 KGSLPEFYYRPPRPP -
p27Kip1 P46527 Y89 GSLPEFYYRPPRPPK -
PKCd (PRKCD) Q05655 Y313 SSEPVGIYQGFEKKT +
PKCd (PRKCD) Q05655 Y334 MQDNSGTYGKIWEGS ?
Yes P07947 Y31 VSTSVSHYGAEPTTV
Yes P07947 Y426 RLIEDNEYTARQGAK +
 

Protein Kinase Specificity

Matrix of observed frequency (%) of amino acids in aligned protein substrate phosphosites

Kinections GIF
Matrix Type:
Predicted from the application of the Kinexus Kinase Substrate Predictor Version 2.0 algorithm, which was trained with over 10,000 kinase-protein substrate pairs and 8,000 kinase-peptide substrate pairs.
Domain #:
1
 

Inhibitors

For further details on these inhibitors click on the Compound Name and enter it into DrugKiNET or click on the ID's
Based on in vitro and/or in vivo phosphorylation data
Compound Name KD, Ki or IC50 (nM) PubChem ID ChEMBL ID PubMed ID
Dasatinib Kd = 300 pM 11153014 1421 18183025
Bosutinib IC50 = 400 pM 5328940 288441 19039322
Ponatinib IC50 = 890 pM 24826799 20513156
CHEMBL249097 Kd = 1 nM 25138012 249097 19035792
CHEMBL436137 IC50 = 1 nM 11719421 436137 16931012
CHEMBL364623 IC50 = 2 nM 11153014 364623 17154512
AZD0530 analogue 15 IC50 = 3 nM 10301884 223460 17064066
Saracatinib IC50 = 4 nM 10302451 217092 17064066
HG-9-91-01 IC50 < 8 nM
BX517 IC50 = 10 nM 11161844 228654
CHEMBL230686 IC50 = 10 nM 11562302 230686 18311895
Hesperadin Kd < 10 nM 10142586 514409 19035792
KIN 112 IC50 = 10 nM
SureCN7018367 Kd < 10 nM 18792927 450519 19035792
MK1775 IC50 = 14 nM 24856436 19887545
KW2449 Kd = 18 nM 11427553 1908397 22037378
SU6656 IC50 = 20 nM 5353978 605003 18077363
NVP-TAE684 Kd = 23 nM 16038120 509032 22037378
Lck Inhibitor IC50 < 25 nM 6603792 22037377
PP121 IC50 < 25 nM 24905142 18849971
Amgen TBK 1 inhibitor (Compound II) IC50 < 40 nM
Ibrutinib IC50 < 40 nM 24821094 1873475
PP1 IC50 < 40 nM 1400 306380
PP2 IC50 < 40 nM 4878 406845
Princeton's TrkA inhibitor compound 20h IC50 < 40 nM
TTT-3002 IC50 < 40 nM
Foretinib Kd = 48 nM 42642645 1230609 22037378
Staurosporine Kd = 49 nM 5279 15711537
Aloisine A IC50 > 50 nM 5326843 75680 22037377
Cdk1/2 Inhibitor III IC50 > 50 nM 5330812 261720 22037377
Dovitinib IC50 > 50 nM 57336746 22037377
IDR E804 IC50 > 50 nM 6419764 1802727 22037377
Src Kinase Inhibitor I IC50 > 50 nM 1474853 97771 22037377
SU11652 IC50 > 50 nM 24906267 13485 22037377
TWS119 IC50 > 50 nM 9549289 405759 22037377
Vandetanib IC50 > 50 nM 3081361 24828 22037377
MK5108 IC50 = 51 nM 24748204 20053775
Nintedanib Kd = 80 nM 9809715 502835 22037378
Purvalanol A IC50 < 80 nM 456214 23327
Purvalanol B IC50 < 80 nM 448991 23254
SureCN3470757 IC50 < 80 nM 11588244 375236
AT9283 IC50 > 100 nM 24905142 19143567
BML-275 IC50 = 100 nM 11524144 478629
BMS-690514 Kd < 100 nM 11349170 21531814
GSK-3 Inhibitor IX IC50 = 100 nM 5287844 409450
PP242 IC50 = 100 nM 25243800
R406 IC50 = 100 nM 11984591
Staurosporine aglycone IC50 = 100 nM 3035817 281948
STO609 IC50 = 100 nM 51371511
Sunitinib IC50 = 100 nM 5329102 535
Syk Inhibitor IC50 = 100 nM 6419747 104279
ZINC01386783 IC50 < 100 nM 1474853 97771
TG101348 Kd = 120 nM 16722836 1287853 22037378
Flt-3 Inhibitor II IC50 > 150 nM 11601743 377193 22037377
GSK-3 Inhibitor XIII IC50 > 150 nM 6419766 359482 22037377
K-252a; Nocardiopsis sp. IC50 > 150 nM 3813 281948 22037377
Ki11502 IC50 > 150 nM 22037377
N-Benzoylstaurosporine IC50 > 150 nM 56603681 608533 22037377
NU6140 IC50 > 150 nM 10202471 1802728 22037377
PP1 Analog II; 1NM-PP1 IC50 > 150 nM 5154691 573578 22037377
SU11274 IC50 > 150 nM 9549297 261641 22037377
Lestaurtinib Kd = 160 nM 126565 22037378
Neratinib Kd = 240 nM 9915743 180022 22037378
4557W IC50 > 250 nM 9843206 563845 22037377
Alsterpaullone IC50 > 250 nM 5005498 50894 22037377
Alsterpaullone; 2-Cyanoethyl IC50 > 250 nM 16760286 260138 22037377
CGP74514A IC50 > 250 nM 2794188 367625 22037377
Compound 52 IC50 > 250 nM 2856 22037377
Compound 56 IC50 > 250 nM 2857 29197 22037377
Flt-3 Inhibitor III IC50 > 250 nM 11772958 22037377
JAK3 Inhibitor VI IC50 > 250 nM 16760524 22037377
SB218078 IC50 > 250 nM 447446 289422 22037377
WHI-P154 IC50 > 250 nM 3795 473773 22037377
AST-487 Kd = 260 nM 11409972 574738 18183025
Cediranib Kd = 260 nM 9933475 491473 22037378
MLN8054 Kd = 260 nM 11712649 259084 18183025
SU14813 Kd = 260 nM 10138259 1721885 18183025
TG101209 IC50 < 300 nM 16722832 17541402
Tozasertib Kd = 470 nM 5494449 572878 18183025
Alisertib IC50 < 500 nM 24771867 22016509
Aloisine; RP106 IC50 = 500 nM 44350092 126343 22037377
BPIQ-I IC50 = 500 nM 2427 22037377
GSK-3 Inhibitor X IC50 = 500 nM 6538818 430226 22037377
IKK-2 Inhibitor IV IC50 = 500 nM 9903786 257167 22037377
Indirubin-3′-monoxime IC50 = 500 nM 5326739 22037377
JNJ-7706621 IC50 = 500 nM 5330790 191003 22037377
Masitinib IC50 = 500 nM 10074640 22037377
Pazopanib IC50 = 500 nM 10113978 477772 22037377
PKR Inhibitor IC50 = 500 nM 6490494 235641 22037377
Semaxinib IC50 = 500 nM 5329098 276711 22037377
K00596a IC50 < 600 nM 9549298 200027
LDN193189 IC50 < 600 nM 25195294 513147
Vemurafenib IC50 = 604 nM 42611257 1229517 20823850
Crizotinib Kd = 770 nM 11626560 601719 22037378
Aurora A Inhibitor 1 (DF) Kd < 800 nM 21992004
Aurora A Inhibitor 23 (DF) Kd < 800 nM 21992004
JNKIN8 IC50 < 800 nM 57340686
Pelitinib Kd = 840 nM 6445562 607707 15711537
RAF265 Kd = 940 nM 11656518 558752 18183025
(5Z)-7-Oxozeaenol IC50 = 1 µM 1077979
AG1478 IC50 = 1 µM 2051 7917
AGL2043 IC50 > 1 µM 9817165 22037377
CHEMBL566515 IC50 < 1 µM 44478401 566515 19788238
CP673451 IC50 > 1 µM 10158940 15705896
Curcumin IC50 = 1 µM 5281767 116438
Gö6976 IC50 > 1 µM 3501 302449 22037377
GSK429286 IC50 = 1 µM 11373846 375312
GW441756 hydrochloride IC50 = 1 µM 16219400
Icotinib IC50 > 1 µM 22024915 22112293
IKK-3 inhibitor IX IC50 = 1 µM 11626927 373751
IPA-3 IC50 = 1 µM 521106 472940
JNJ-10198409 IC50 > 1 µM 9797370 120077 22037377
JNKIN7 IC50 = 1 µM 57340685
Kenpaullone IC50 > 1 µM 3820 296586 22037377
MNK1 Inhibitor IC50 = 1 µM 11644425 1240885
Nilotinib IC50 > 1 µM 644241 255863 22037377
PLX4720 IC50 = 1 µM 24180719 1230020
Quercetagetin IC50 = 1 µM 5281680 413552
Ro-31-8220 IC50 = 1 µM 5083 6291
Ruxolitinib IC50 = 1 µM 25126798 1789941
Silmitasertib IC50 > 1 µM 24748573 21174434
SNS314 IC50 > 1 µM 16047143 514582 18678489
SureCN10063060 Ki > 1 µM 52936621 21391610
Syk Inhibitor II IC50 = 1 µM 16760670
VEGFR2 Kinase Inhibitor I IC50 > 1 µM 6419834 86943 22037377
VEGFR2 Kinase Inhibitor II IC50 > 1 µM 5329155 88606 22037377
VEGFR2 Kinase Inhibitor IV IC50 > 1 µM 5329468 92461 22037377
Wyeth PDK1 Inhibitor Compound 1 IC50 = 1 µM
WZ3146 Kd > 1 µM 44607360 20033049
WZ4002 Kd > 1 µM 44607530 20033049
BGJ398 IC50 = 1.1 µM 53235510 21936542
CHEMBL1240703 Kd = 1.1 µM 52945601 1240703 19654408
PHA-665752 Kd = 1.4 µM 10461815 450786 22037378
Canertinib Kd = 1.6 µM 156414 31965 18183025
VX745 Kd = 1.6 µM 3038525 119385 18183025
Momelotinib IC50 > 2 µM 25062766 19295546
Orantinib IC50 < 2 µM 5329099 274654
SB202190 IC50 = 2 µM 5353940 278041
Erlotinib Kd = 2.2 µM 176870 553 18183025
Axitinib Kd = 2.7 µM 6450551 1289926 22037378
A-83-01 IC50 > 3 µM 16218924 1170377
Ruboxistaurin IC50 > 3 µM 153999 91829
Tofacitinib IC50 > 3 µM 9926791 221959
SureCN4875304 IC50 > 3.5 µM 46871765 20472445
Barasertib Kd = 3.8 µM 16007391 215152 18183025
BX795 IC50 < 4 µM 10077147 577784
EGCG (Epigallocatechin Gallate) IC50 < 4 µM 65064 297453
JNJ-28871063 IC50 > 4 µM 17747413 17975007
Doramapimod IC50 > 4.5 µM 156422 103667
H-1152; Glycyl IC50 > 4.5 µM 16760635
MRT67307 IC50 > 4.5 µM 44464263
MSC 2032964A IC50 > 4.5 µM
 

Disease Linkage

General Disease Association:

Cancer, gastrointestinal disorders
Specific Diseases (Non-cancerous):

Megaesophagus
Specific Cancer Types:
Follicular lymphomas; Sarcomas
Comments:
Yes may be an oncoprotein (OP) based on its similarity to other Src family protein-tyrosine kinases. Yes is the cellular homologue of the Yamaguchi sarcoma virus oncoprotein. By isotopic in situ hybridization, Yes1 gene localization is frequently associated with chromosome translocation and pathogenesis of follicular lymphoma.
 
Gene Expression in Cancers:

TranscriptoNET (www.transcriptonet.ca) analysis with mRNA expression data retrieved from the National Center for Biotechnology Information's Gene Expression Omnibus (GEO) database, which was normalized against 60 abundantly and commonly found proteins, indicated altered expression for this protein kinase as shown here as the percent change from normal tissue controls (%CFC) as supported with the Student T-test in the following types of human cancers: Bladder carcinomas (%CFC= +123, p<(0.0003); Brain glioblastomas (%CFC= -61, p<0.008); Brain oligodendrogliomas (%CFC= -58, p<0.031); Head and neck squamous cell carcinomas (HNSCC) (%CFC= +45, p<0.043); and Oral squamous cell carcinomas (OSCC) (%CFC= +59, p<0.002). The COSMIC website notes an up-regulated expression score for Yes in diverse human cancers of 569, which is 1.2-fold of the average score of 462 for the human protein kinases. The down-regulated expression score of 116 for this protein kinase in human cancers was 1.9-fold of the average score of 60 for the human protein kinases.
Mutagenesis Experiments:

Insertional mutagenesis studies in mice have not yet revealed a role for this protein kinase in mouse cancer oncogenesis. A Y426F mutation in Yes leads to about a 50% reduction in CSK-mediated inhibition of its phosphotransferase activity.
Mutation Rate in All Cancers:

Percent mutation rates per 100 amino acids length in human cancers: 0.07 % in 25126 diverse cancer specimens. This rate is only -8 % lower and is very similar to the average rate of 0.075 % calculated for human protein kinases in general.
Frequency of Mutated Sites:

None > 4 in 20,409 cancer specimens
Comments:
Only 2 deletions, and no insertions or complex mutations are noted on the COSMIC website.
 
COSMIC Entry:
YES1
OMIM Entry:
164880
  • Home
  • Top of Page
Copyright 2019 Kinexus BioInformatics Corporation