
Nomenclature
Short Name:
RON
Full Name:
Macrophage-stimulating protein receptor
Alias:
- CD136
- CD136 antigen
- Macrophage stimulating 1 receptor
- Macrophage-stimulating protein receptor precursor
- MSP receptor
- MST1R; PTK8; STK
- CDW136
- C-met-related tyrosine kinase
- EC 2.7.10.1K
- Kinase RON
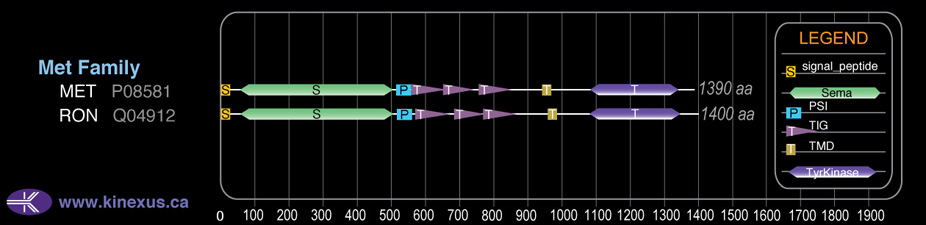
Classification
Type:
Protein-tyrosine kinase
Group:
TK
Family:
Met
SubFamily:
NA

Specific Links
Structure
Mol. Mass (Da):
152271
# Amino Acids:
1400
# mRNA Isoforms:
6
mRNA Isoforms:
152,271 Da (1400 AA; Q04912); 147,277 Da (1351 AA; Q04912-2); 97,315 Da (907 AA; Q04912-5); 69,265 Da (647 AA; Q04912-6); 57,721 Da (541 AA; Q04912-4); 52,519 Da (495 AA; Q04912-3)
4D Structure:
Heterodimer formed of an alpha chain and a beta chain which are disulfide linked. Binds PLXNB1. Associates with and is negatively regulated by HYAL2.
1D Structure:
3D Image (rendered using PV Viewer):
PDB ID
Subfamily Alignment
Domain Distribution:
Kinexus Products
Click on entries below for direct links to relevant products from Kinexus for this protein kinase.
hiddentext
Post-translation Modifications
For detailed information on phosphorylation of this kinase go to PhosphoNET
N-GlcNAcylated:
N66, N419, N458, N488, N654, N720, N841, N897.
Serine phosphorylated:
S215, S226, S236, S1240+, S1394.
Tyrosine phosphorylated:
Y1012, Y1017, Y1101+, Y1198+, Y1238+, Y1239+, Y1288+, Y1317, Y1353, Y1360.
Ubiquitinated:
K222, K1223.
Distribution
Based on gene microarray analysis from the NCBI
Human Tissue Distribution
% Max Expression:
Mean Expression:
Number of Samples:
Standard Deviation:
% Max Expression:
Mean Expression:
Number of Samples:
Standard Deviation:
 38
38
696
16
1002
 2
2
29
10
34
 9
9
174
15
309
 25
25
459
65
1100
 30
30
545
14
544
 8
8
146
46
214
 23
23
423
19
608
 35
35
651
28
1641
 33
33
608
10
535
 5
5
88
59
132
 3
3
61
31
104
 28
28
524
111
628
 6
6
106
29
239
 1
1
25
7
32
 2
2
44
11
36
 1
1
21
8
17
 20
20
367
116
2080
 4
4
81
25
169
 4
4
69
60
55
 30
30
562
56
572
 3
3
58
27
133
 6
6
104
21
173
 12
12
224
27
206
 3
3
57
25
107
 6
6
117
27
218
 52
52
958
44
2477
 4
4
81
30
112
 6
6
119
25
196
 4
4
82
25
162
 9
9
172
14
105
 19
19
350
18
246
 100
100
1844
21
4066
 0.05
0.05
1
57
1
 30
30
562
31
556
 6
6
103
22
56
Evolution
Species Conservation
PhosphoNET % Identity:
PhosphoNET % Similarity:
Homologene %
Identity:
PhosphoNET % Identity:
PhosphoNET % Similarity:
Homologene %
Identity:
 100
100
100
100 34.6
34.6
52.2
99.5 90.9
90.9
93.7
95 -
-
-
81 -
-
-
85 79.5
79.5
85.7
81 -
-
-
- 74.6
74.6
83.4
76 34.9
34.9
52.9
77 -
-
-
- 34.2
34.2
51.9
- 47.1
47.1
61.5
49 42.6
42.6
59.1
46 39
39
55
43 -
-
-
- -
-
-
- -
-
-
- -
-
-
48 27.2
27.2
44.2
- -
-
-
- -
-
-
- -
-
-
- -
-
-
- -
-
-
- -
-
-
-
For a wider analysis go to PhosphoNET Evolution in PhosphoNET
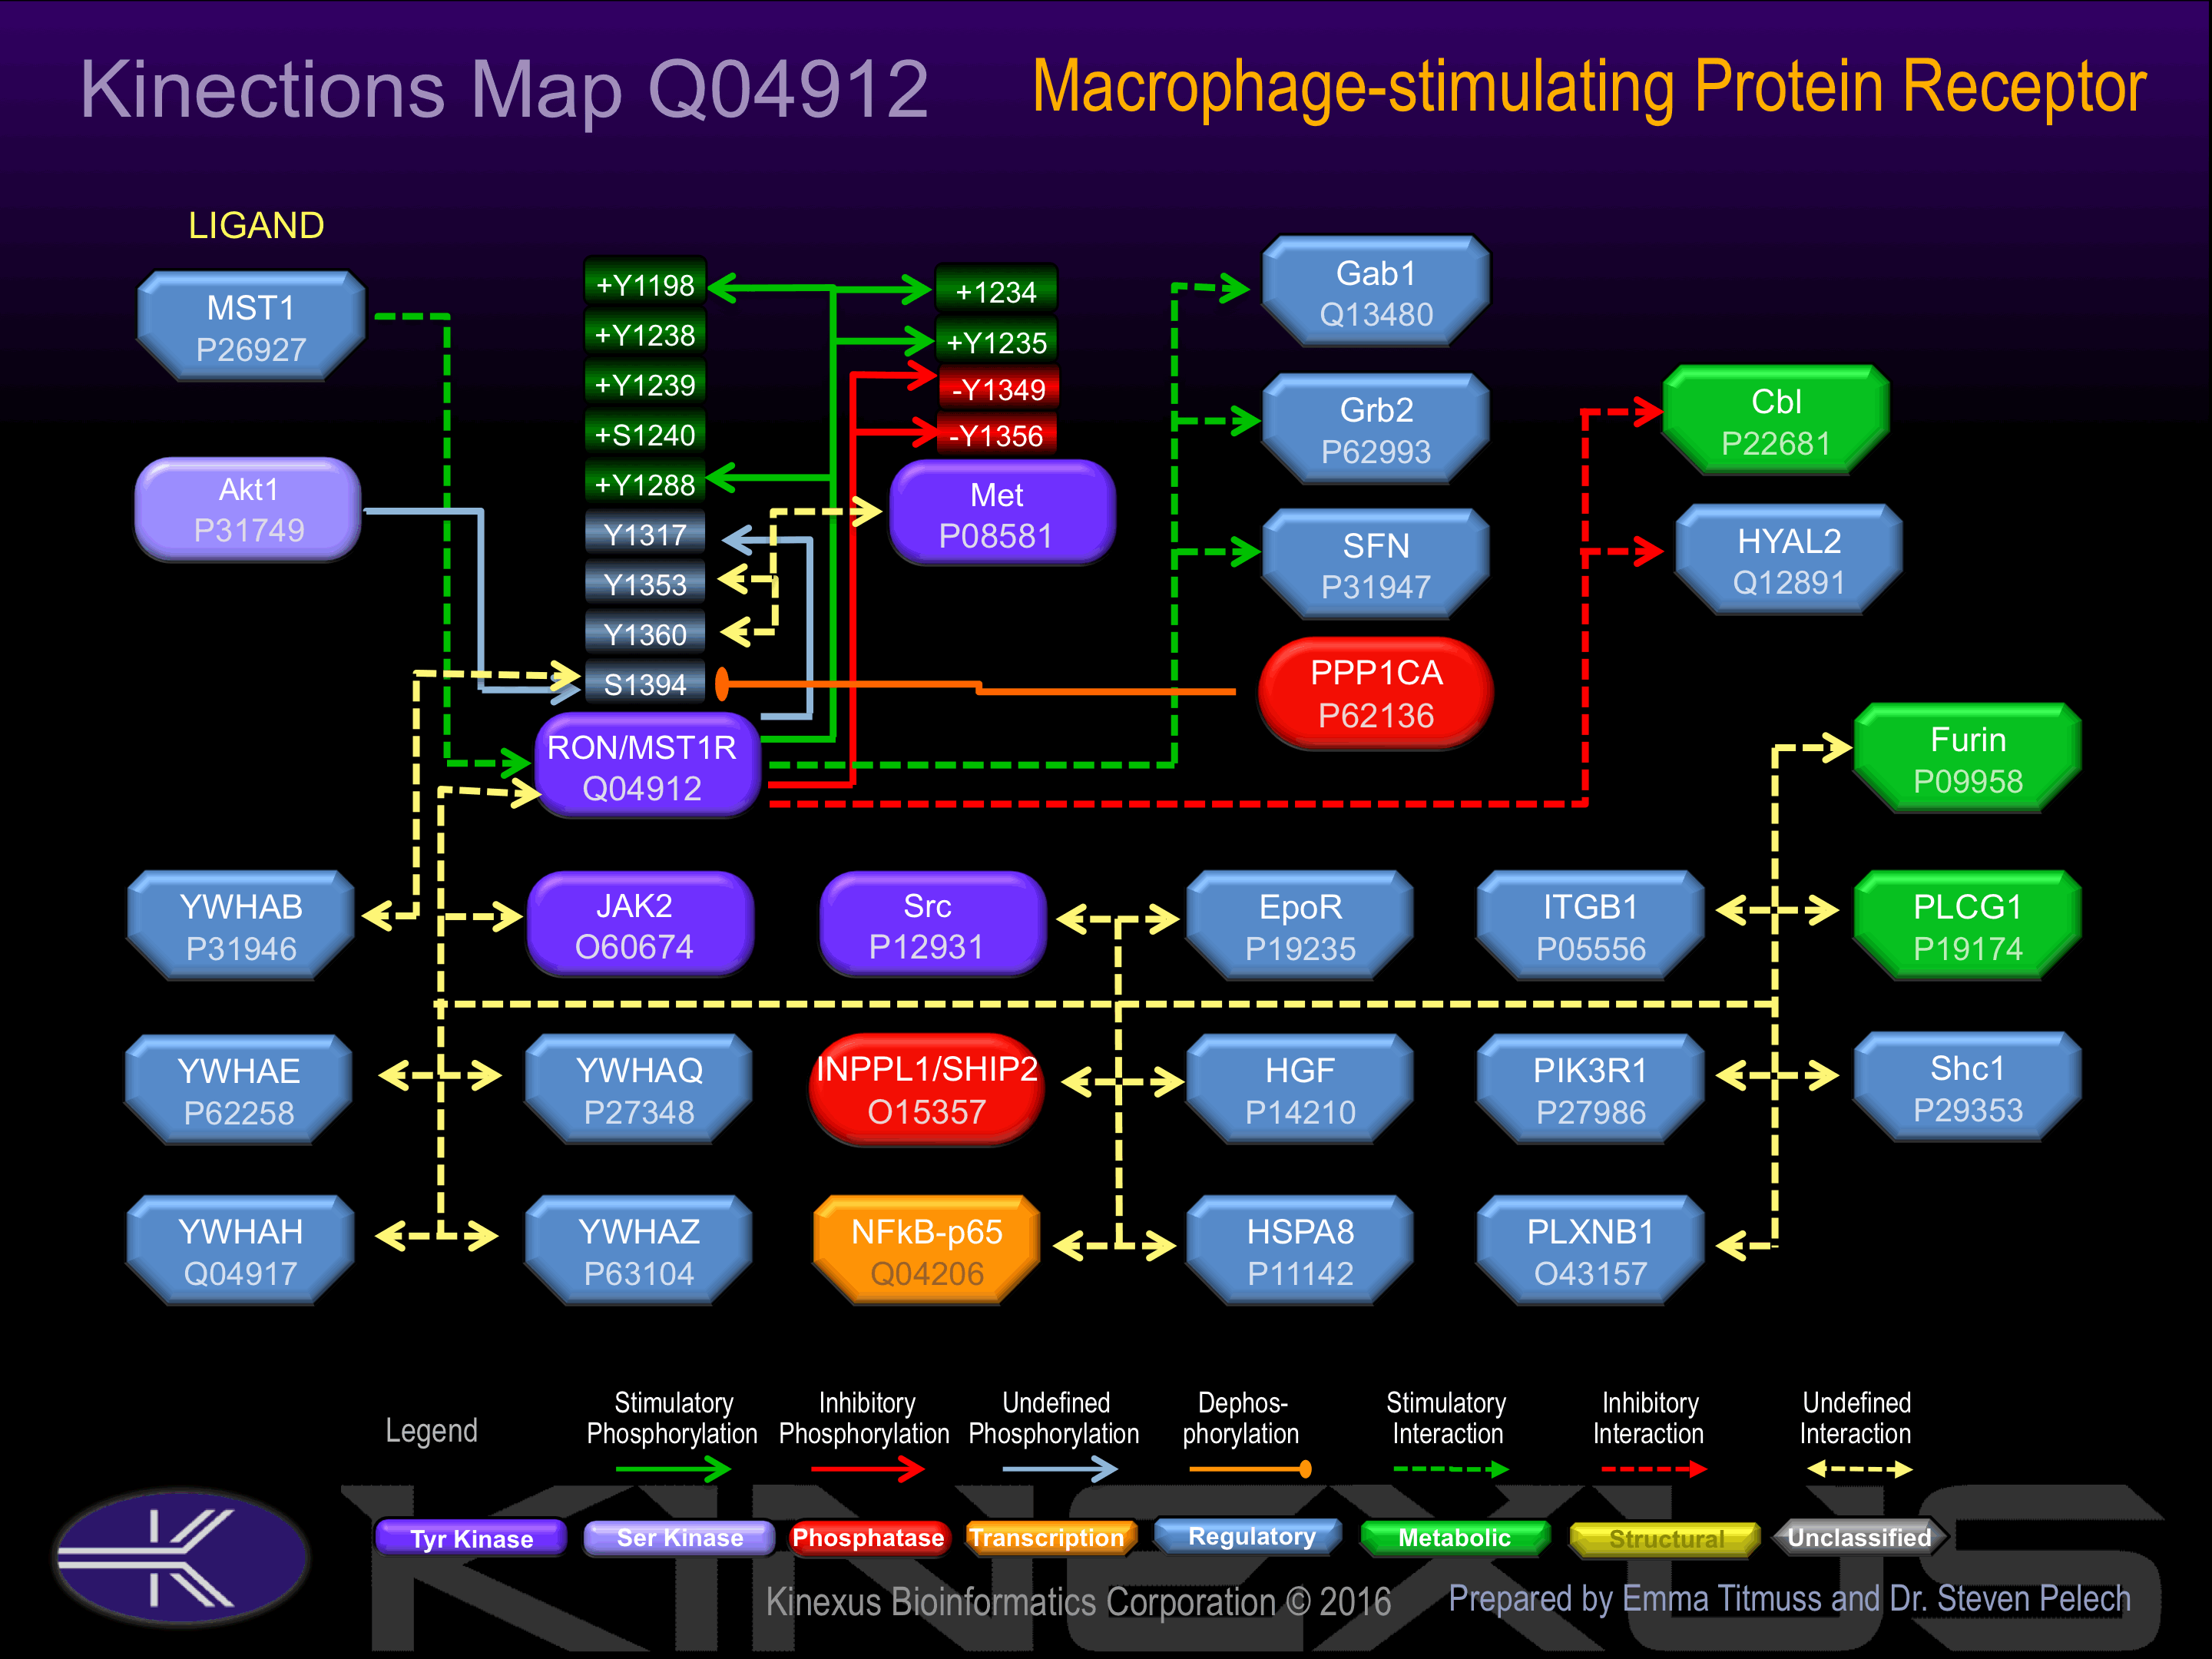
Binding Proteins
Examples of known interacting proteins
hiddentext
| No. | Name – UniProt ID |
|---|---|
| 1 | GRB2 - P62993 |
| 2 | JAK2 - O60674 |
| 3 | HYAL2 - Q12891 |
| 4 | EPOR - P19235 |
| 5 | GAB1 - Q13480 |
| 6 | PLCG1 - P19174 |
| 7 | PIK3R1 - P27986 |
| 8 | SRC - P12931 |
| 9 | SHC1 - P29353 |
| 10 | RELA - Q04206 |
| 11 | YES1 - P07947 |
| 12 | CBL - P22681 |
| 13 | YWHAZ - P63104 |
| 14 | AKT1 - P31749 |
| 15 | YWHAQ - P27348 |
Regulation
Activation:
Activated by binding macrophage stimulating factor (MSF). Phosphorylation Tyr-1198 and Tyr-1288 increases phosphotransferase activity..
Inhibition:
Phosphorylation at Ser-1394 induces interaction with 14-3-3 beta.
Synthesis:
NA
Degradation:
NA
Known Upstream Kinases
For further details on these substrates click on the Substrate Short Name or UniProt ID. Phosphosite Location is hyperlinked to PhosphoNET
predictions.
Based on in vitro and/or in vivo phosphorylation data
| Kinase Short Name | UniProt ID (Human) | Phosphosite Location | Phosphosite Sequence | Effect of Phosphorylation |
|---|
Known Downstream Substrates
For further details on these substrates click on the Substrate Short Name or UniProt ID. Phosphosite Location is hyperlinked to PhosphoNET
predictions.
Based on in vitro and/or in vivo phosphorylation data
| Substrate Short Name | UniProt ID (Human) | Phosphosite Location | Phosphosite Sequence | Effect of Phosphorylation |
|---|
Protein Kinase Specificity
Matrix of observed frequency (%) of amino acids in aligned protein substrate phosphosites
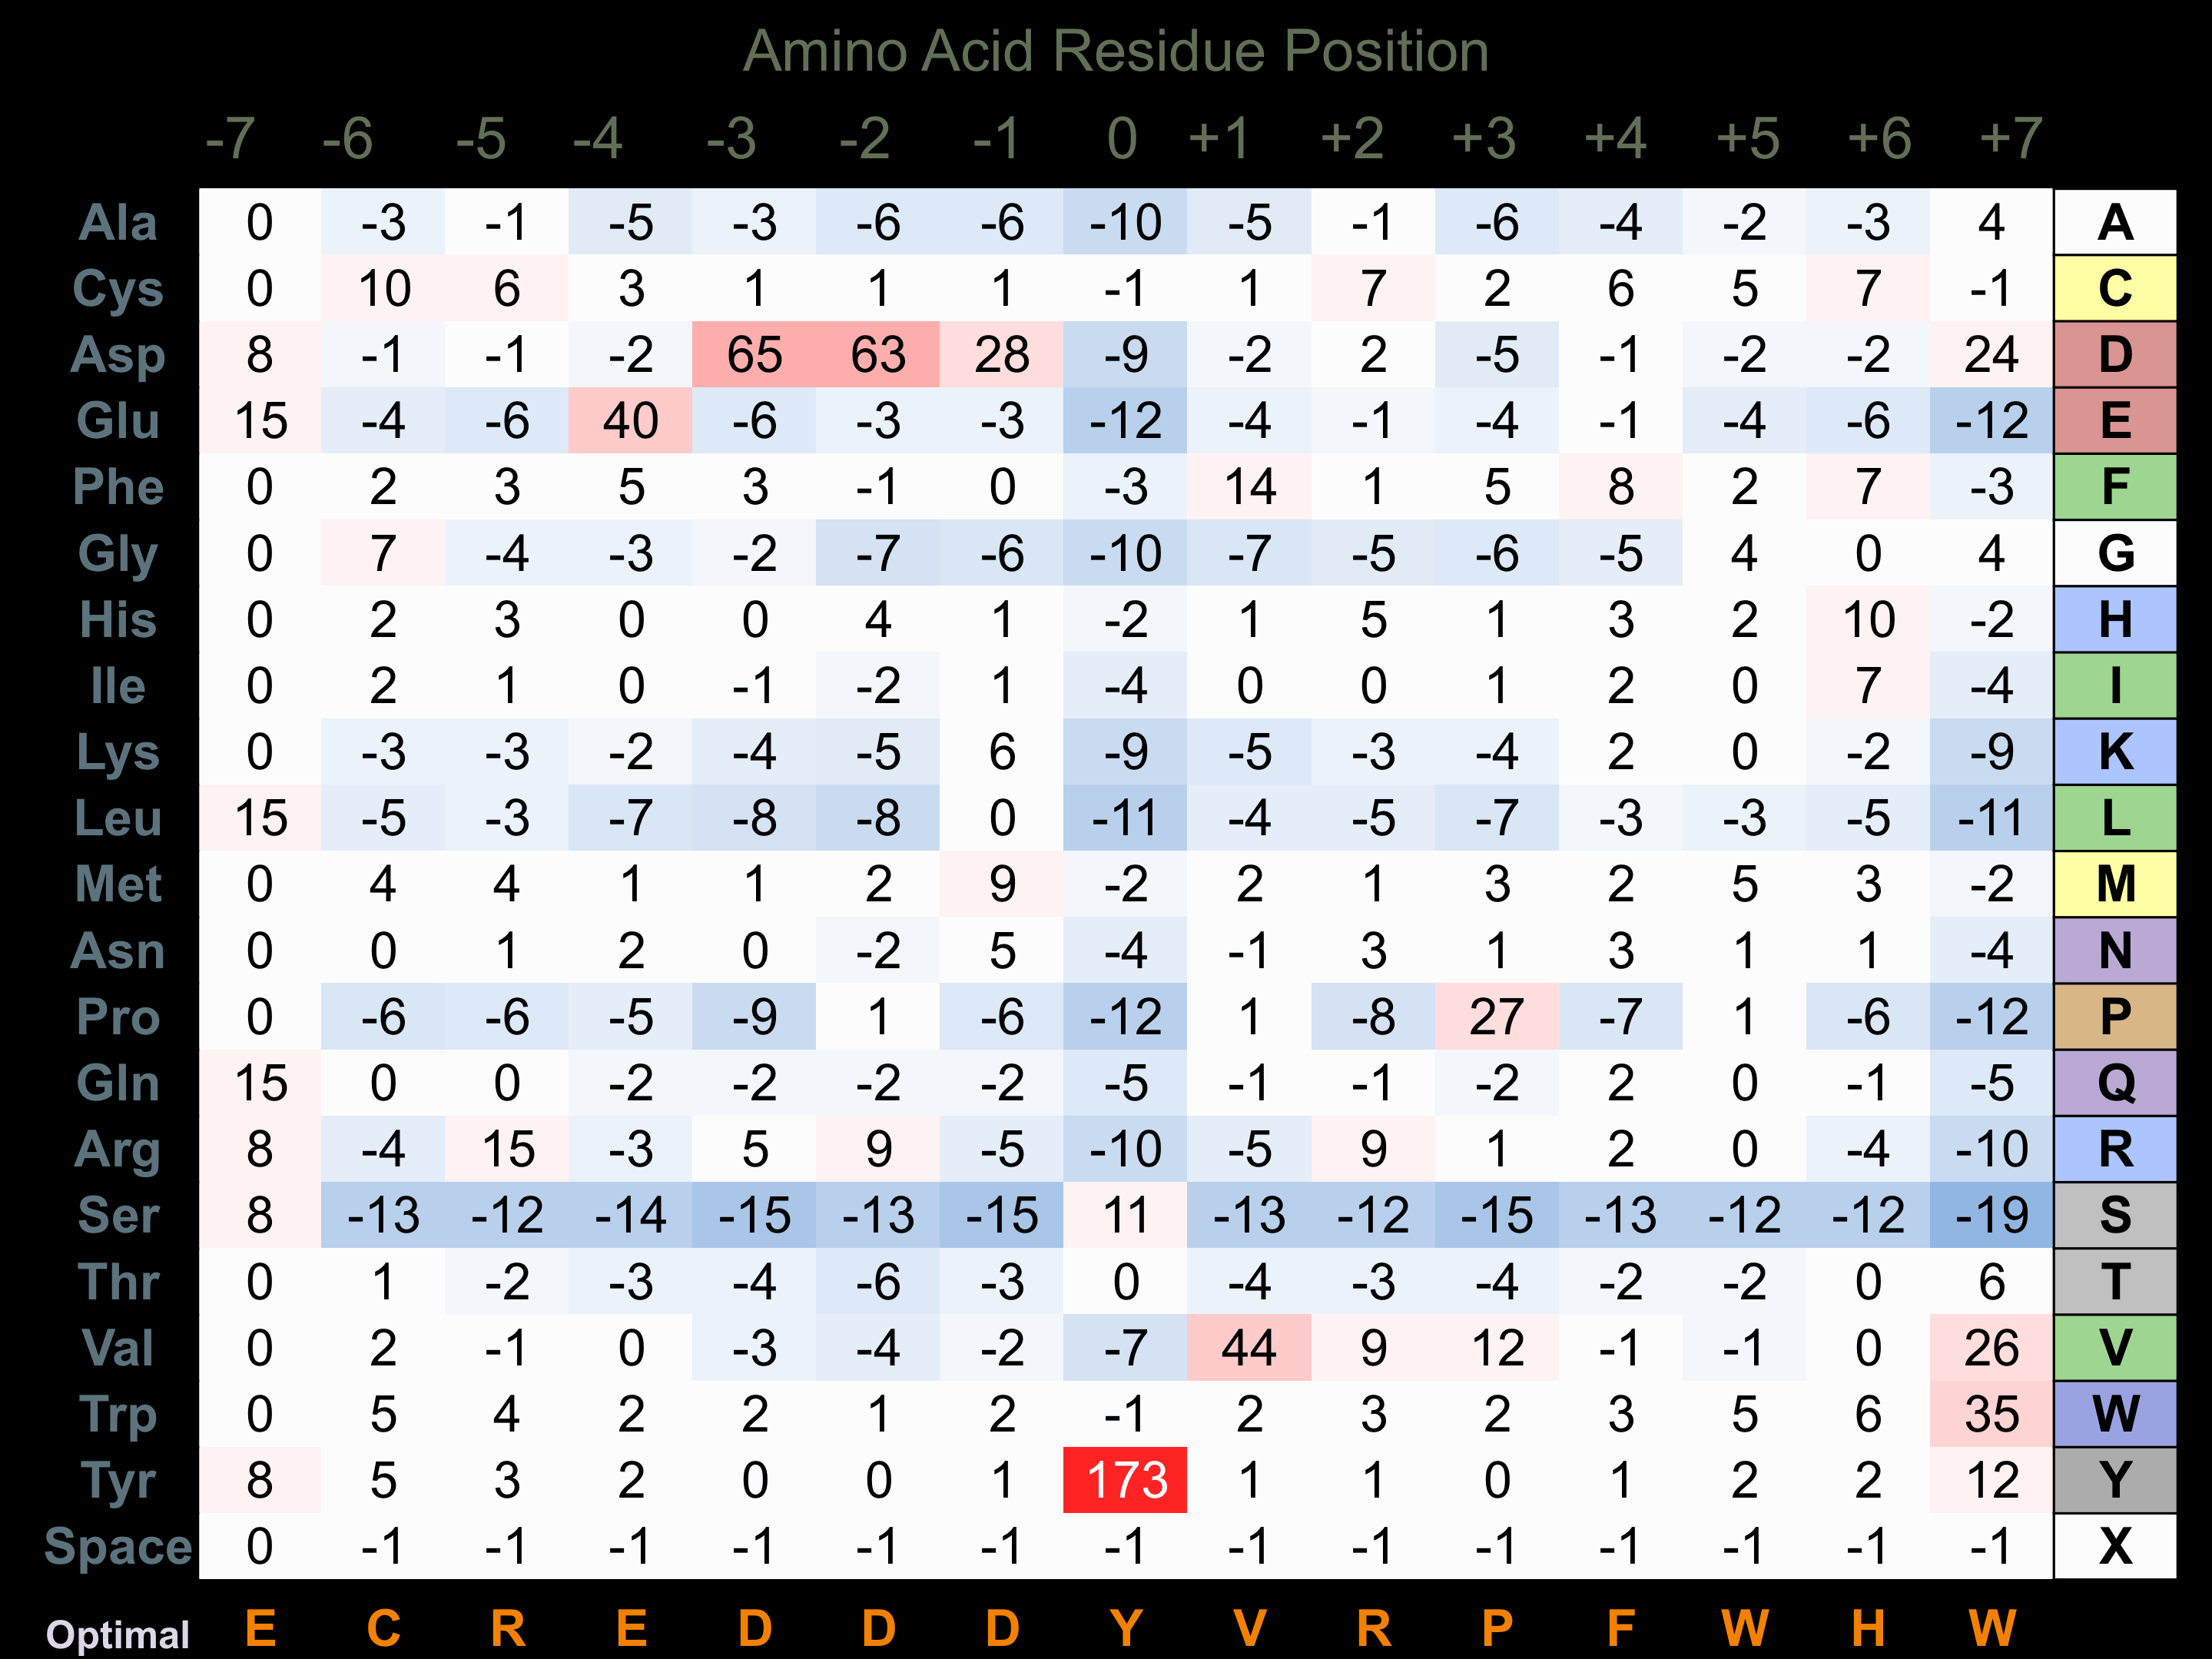
Matrix Type:
Experimentally derived from alignment of 10 known protein substrate phosphosites and 98 peptides phosphorylated by recombinant RON in vitro tested in-house by Kinexus.
Domain #:
1
Inhibitors
For further details on these inhibitors click on the Compound Name and enter it into DrugKiNET or click on the ID's
Based on in vitro and/or in vivo phosphorylation data
| Compound Name | KD, Ki or IC50 (nM) | PubChem ID | ChEMBL ID | PubMed ID |
|---|
Disease Linkage
General Disease Association:
Cancer
Specific Cancer Types:
Pancreatic cancer; Renal oncocytomas
Comments:
RON is linked to pancreatic cancer, which is a rare cancer that does not have characteristic symptoms but is related to the Integrated Breast Cancer Pathway and the Integrated Pancreatic Cancer Pathway. Renal oncocytoma is a rare form of epithelial kidney cancer where tumours arise from oncoytes (cell characterized by having excessive numbers of mitochondria).
Gene Expression in Cancers:
TranscriptoNET (www.transcriptonet.ca) analysis with mRNA expression data retrieved from the National Center for Biotechnology Information's Gene Expression Omnibus (GEO) database, which was normalized against 60 abundantly and commonly found proteins, indicated altered expression for this protein kinase as shown here as the percent change from normal tissue controls (%CFC) as supported with the Student T-test in the following types of human cancers: Barrett's esophagus epithelial metaplasia (%CFC= +132, p<0.005); Barrett's esophagus epithelial metaplasia (%CFC= +130, p<0.017); Bladder carcinomas (%CFC= +51, p<0.1); Breast epithelial carcinomas (%CFC= +144, p<0.062); Classical Hodgkin lymphomas (%CFC= +56, p<0.006); Lung adenocarcinomas (%CFC= +63, p<0.0001); Ovary adenocarcinomas (%CFC= +84, p<0.019); Skin fibrosarcomas (%CFC= -78); Skin melanomas (%CFC= -57, p<0.034); and Skin melanomas - malignant (%CFC= -63, p<0.017); The COSMIC website notes an up-regulated expression score for RON in diverse human cancers of 293, which is 0.6-fold of the average score of 462 for the human protein kinases. The down-regulated expression score of 1 for this protein kinase in human cancers was 98% lower than the average score of 60 for the human protein kinases.
Mutagenesis Experiments:
Insertional mutagenesis studies in mice have not yet revealed a role for this protein kinase in mouse cancer oncogenesis.
Mutation Rate in All Cancers:
Percent mutation rates per 100 amino acids length in human cancers: 0.06 % in 25558 diverse cancer specimens. This rate is only -22 % lower than the average rate of 0.075 % calculated for human protein kinases in general.
Mutation Rate in Specific Cancers:
Highest percent mutation rates per 100 amino acids length in human cancers: 0.28 % in 1128 large intestine cancers tested; 0.23 % in 590 stomach cancers tested; 0.22 % in 807 skin cancers tested; 0.18 % in 602 endometrium cancers tested; 0.08 % in 905 ovary cancers tested; 0.07 % in 1944 lung cancers tested.
Frequency of Mutated Sites:
None > 5 in 20,722 cancer specimens
Comments:
Eight deletions, 1 insertion and no complex mutations are noted on the COSMIC website.