
Nomenclature
Short Name:
HPK1
Full Name:
Mitogen-activated protein kinase kinase kinase kinase 1
Alias:
- EC 2.7.11.1
- M4K1
- MAP4K1
- Hematopoietic progenitor kinase
- Hematopoietic progenitor kinase 1
- HPK1
- Kinase HPK1
Classification
Type:
Protein-serine/threonine kinase
Group:
STE
Family:
STE20
SubFamily:
KHS

Specific Links
Structure
Mol. Mass (Da):
91,296
# Amino Acids:
833
# mRNA Isoforms:
2
mRNA Isoforms:
91,296 Da (833 AA; Q92918); 90,425 Da (821 AA; Q92918-2)
4D Structure:
Interacts with MAP3K1
1D Structure:
Subfamily Alignment
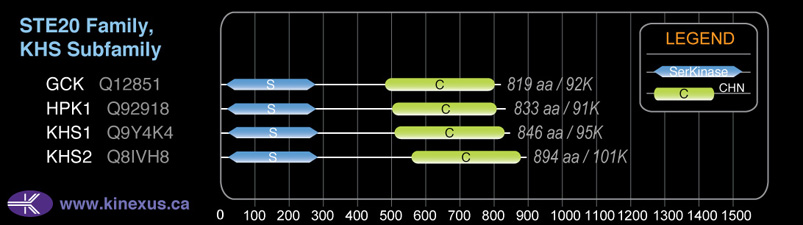
Domain Distribution:
Kinexus Products
Click on entries below for direct links to relevant products from Kinexus for this protein kinase.
hiddentext
Post-translation Modifications
For detailed information on phosphorylation of this kinase go to PhosphoNET
Serine phosphorylated:
S171+, S320, S324, S325, S326, S366, S368, S374, S376, S377, S405, S407, S413, S421, S430, S436, S444, S446, S447, S454, S586, S598.
Threonine phosphorylated:
T165+, T175-, T349, T355, T451, T599.
Tyrosine phosphorylated:
Y28-, Y177, Y381+.
Distribution
Based on gene microarray analysis from the NCBI
Human Tissue Distribution
% Max Expression:
Mean Expression:
Number of Samples:
Standard Deviation:
% Max Expression:
Mean Expression:
Number of Samples:
Standard Deviation:
 34
34
473
42
725
 2
2
34
20
41
 17
17
231
32
390
 21
21
288
145
551
 41
41
577
30
389
 6
6
82
119
257
 12
12
174
43
447
 43
43
597
70
1151
 21
21
291
24
212
 8
8
116
129
358
 11
11
160
56
319
 47
47
661
250
625
 19
19
261
65
188
 1.2
1.2
17
14
26
 13
13
177
48
370
 1.1
1.1
16
22
19
 13
13
178
150
1510
 38
38
523
42
1476
 5
5
65
140
169
 19
19
270
162
322
 6
6
85
45
113
 24
24
330
51
306
 12
12
174
43
266
 23
23
321
43
1409
 32
32
443
45
600
 48
48
663
95
1365
 22
22
313
68
325
 15
15
207
43
532
 6
6
89
43
168
 20
20
283
42
293
 70
70
980
30
938
 100
100
1393
51
1719
 14
14
200
80
475
 59
59
817
83
721
 5
5
75
48
89
Evolution
Species Conservation
PhosphoNET % Identity:
PhosphoNET % Similarity:
Homologene %
Identity:
PhosphoNET % Identity:
PhosphoNET % Similarity:
Homologene %
Identity:
 100
100
100
100 44.5
44.5
61.9
100 25.2
25.2
40.1
93 -
-
-
93 -
-
-
97 89.8
89.8
93.4
93 -
-
-
- 83.1
83.1
89.8
86 44.7
44.7
61.5
87 -
-
-
- 42.4
42.4
58.4
- 25.6
25.6
39.9
- 24
24
39.9
55 24.6
24.6
39.7
- -
-
-
- 25.6
25.6
44.1
- -
-
-
- 23.8
23.8
40.2
- -
-
-
- -
-
-
- -
-
-
- -
-
-
- -
-
-
- -
-
-
- -
-
-
-
For a wider analysis go to PhosphoNET Evolution in PhosphoNET
Binding Proteins
Examples of known interacting proteins
hiddentext
| No. | Name – UniProt ID |
|---|---|
| 1 | GRB2 - P62993 |
| 2 | CRK - P46108 |
| 3 | NCK1 - P16333 |
| 4 | CRKL - P46109 |
| 5 | ABL1 - P00519 |
| 6 | LCP2 - Q13094 |
| 7 | GRAP2 - O75791 |
| 8 | BLNK - Q8WV28 |
| 9 | MAP3K7 - O43318 |
| 10 | DBNL - Q9UJU6 |
| 11 | HCLS1 - P14317 |
| 12 | DAPP1 - Q9UN19 |
| 13 | MAP3K11 - Q16584 |
| 14 | CASP3 - P42574 |
| 15 | SPNS1 - Q9H2V7 |
Regulation
Activation:
NA
Inhibition:
NA
Synthesis:
NA
Degradation:
NA
Known Upstream Kinases
For further details on these substrates click on the Substrate Short Name or UniProt ID. Phosphosite Location is hyperlinked to PhosphoNET
predictions.
Based on in vitro and/or in vivo phosphorylation data
| Kinase Short Name | UniProt ID (Human) | Phosphosite Location | Phosphosite Sequence | Effect of Phosphorylation |
|---|
Known Downstream Substrates
For further details on these substrates click on the Substrate Short Name or UniProt ID. Phosphosite Location is hyperlinked to PhosphoNET
predictions.
Based on in vitro and/or in vivo phosphorylation data
| Substrate Short Name | UniProt ID (Human) | Phosphosite Location | Phosphosite Sequence | Effect of Phosphorylation |
|---|
Protein Kinase Specificity
Matrix of observed frequency (%) of amino acids in aligned protein substrate phosphosites
Matrix Type:
Predicted from the application of the Kinexus Kinase Substrate Predictor Version 2.0 algorithm, which was trained with over 10,000 kinase-protein substrate pairs and 8,000 kinase-peptide substrate pairs.
Domain #:
1
Inhibitors
For further details on these inhibitors click on the Compound Name and enter it into DrugKiNET or click on the ID's
Based on in vitro and/or in vivo phosphorylation data
| Compound Name | KD, Ki or IC50 (nM) | PubChem ID | ChEMBL ID | PubMed ID |
|---|
Disease Linkage
General Disease Association:
Skin disorders
Specific Diseases (Non-cancerous):
Extramammary Paget disease (EMPD)
Comments:
Extramammary Paget disease (EMPD) has been associated with cytoplasmic overexpression of HPK1, and severity of disease increases with HPK1 expression. EMPD can affect nipple, commonly in women, but may also affect the testicles.
Gene Expression in Cancers:
TranscriptoNET (www.transcriptonet.ca) analysis with mRNA expression data retrieved from the National Center for Biotechnology Information's Gene Expression Omnibus (GEO) database, which was normalized against 60 abundantly and commonly found proteins, indicated altered expression for this protein kinase as shown here as the percent change from normal tissue controls (%CFC) as supported with the Student T-test in the following types of human cancers: Cervical cancer stage 2B (%CFC= -54, p<0.008); Colorectal adenocarcinomas (early onset) (%CFC= +91, p<0.004); Gastric cancer (%CFC= -59, p<0.004); Large B-cell lymphomas (%CFC= +219, p<0.0001); Ovary adenocarcinomas (%CFC= +366, p<0.0001); Prostate cancer (%CFC= -68, p<0.084); and Uterine leiomyomas (%CFC= +464, p<0.005). The COSMIC website notes an up-regulated expression score for HPK1 in diverse human cancers of 308, which is 0.7-fold of the average score of 462 for the human protein kinases. The down-regulated expression score of 0 for this protein kinase in human cancers was 100% lower than the average score of 60 for the human protein kinases.
Mutagenesis Experiments:
Insertional mutagenesis studies in mice have not yet revealed a role for this protein kinase in mouse cancer oncogenesis. A T355A mutation does not affect its phosphotransferase activity, but will prevent Cul7-RING ubiquitin complex (containing FBXW8) binding and inhibit degradation of the protein.
Mutation Rate in All Cancers:
Percent mutation rates per 100 amino acids length in human cancers: 0.08 % in 25457 diverse cancer specimens. This rate is very similar (+ 5% higher) to the average rate of 0.075 % calculated for human protein kinases in general.
Mutation Rate in Specific Cancers:
Highest percent mutation rates per 100 amino acids length in human cancers: 0.4 % in 805 skin cancers tested; 0.32 % in 1093 large intestine cancers tested; 0.24 % in 602 endometrium cancers tested; 0.24 % in 500 urinary tract cancers tested; 0.19 % in 1942 lung cancers tested; 0.08 % in 1466 breast cancers tested.
Frequency of Mutated Sites:
None > 4 in 20,656 cancer specimens
Comments:
Only 1 deletion, and no insertions or complex mutations are noted on the COSMIC website.