
Nomenclature
Short Name:
MARK2
Full Name:
Serine-threonine-protein kinase MARK2
Alias:
- EC 2.7.11.1
- ELKL motif kinase 1
- MAP/microtubule affinity-regulating kinase 2
- PAR-1
- Par1b
- PAR-1b
- EMK
- EMK1
- Kinase MARK2
- MGC99619
Classification
Type:
Protein-serine/threonine kinase
Group:
CAMK
Family:
CAMKL
SubFamily:
MARK

Specific Links
Structure
Mol. Mass (Da):
87,911
# Amino Acids:
788
# mRNA Isoforms:
16
mRNA Isoforms:
87,911 Da (788 AA; Q7KZI7); 86,762 Da (779 AA; Q7KZI7-8); 86,129 Da (773 AA; Q7KZI7-11); 84,333 Da (755 AA; Q7KZI7-6); 83,184 Da (746 AA; Q7KZI7-3); 83,113 Da (745 AA; Q7KZI7-14); 82,551 Da (740 AA; Q7KZI7-12); 82,429 Da (734 AA; Q7KZI7-9); 81,280 Da (725 AA; Q7KZI7-4); 81,209 Da (724 AA; Q7KZI7-16); 80,647 Da (719 AA; Q7KZI7-5); 79,427 Da (709 AA; Q7KZI7-15); 78,851 Da (701 AA; Q7KZI7-2); 77,702 Da (692 AA; Q7KZI7-7); 77,631 Da (691 AA; Q7KZI7-13); 77,069 Da (686 AA; Q7KZI7-10)
4D Structure:
NA
1D Structure:
Subfamily Alignment
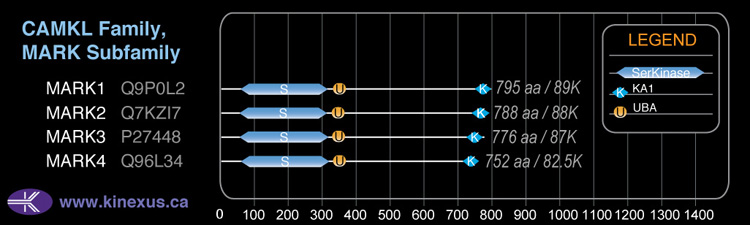
Domain Distribution:
Kinexus Products
Click on entries below for direct links to relevant products from Kinexus for this protein kinase.
hiddentext
Post-translation Modifications
For detailed information on phosphorylation of this kinase go to PhosphoNET
Serine phosphorylated:
S26, S29, S30, S40, S43, S197, S212-, S290, S365, S380, S386, S390, S400, S409, S422, S449, S456, S471, S477, S479, S483, S486, S493, S498, S533, S535, S569, S571, S576, S578, S592, S593, S595, S619, S621, S624, S631, S633, S648, S675, S692, S698, S722, S759.
Threonine phosphorylated:
T6, T20, T42, T58, T87, T201, T208+, T329, T338, T450, T466, T467, T469, T472, T596-, T616, T667.
Tyrosine phosphorylated:
Y323, Y337, Y351, Y358, Y363, Y613.
Ubiquitinated:
K637.
Distribution
Based on gene microarray analysis from the NCBI
Human Tissue Distribution
% Max Expression:
Mean Expression:
Number of Samples:
Standard Deviation:
% Max Expression:
Mean Expression:
Number of Samples:
Standard Deviation:
 100
100
933
32
1622
 6
6
53
14
49
 26
26
241
35
290
 30
30
276
117
406
 65
65
607
22
499
 2
2
18
74
16
 34
34
313
35
476
 38
38
354
65
433
 37
37
348
17
256
 9
9
88
118
128
 12
12
114
60
150
 46
46
429
219
500
 15
15
142
57
184
 5
5
48
12
35
 23
23
211
52
253
 4
4
33
14
20
 7
7
64
226
160
 30
30
280
44
297
 8
8
73
116
159
 43
43
402
109
480
 19
19
175
50
182
 21
21
198
56
239
 30
30
277
45
484
 19
19
181
42
198
 22
22
204
50
243
 47
47
441
75
466
 35
35
323
60
668
 45
45
417
42
1258
 19
19
180
44
195
 9
9
83
28
119
 63
63
592
36
424
 80
80
742
36
789
 6
6
59
102
178
 62
62
581
57
533
 19
19
174
53
303
Evolution
Species Conservation
PhosphoNET % Identity:
PhosphoNET % Similarity:
Homologene %
Identity:
PhosphoNET % Identity:
PhosphoNET % Similarity:
Homologene %
Identity:
 100
100
100
100 68.2
68.2
80.4
100 99.8
99.8
99.8
100 -
-
-
98 -
-
-
99 95.1
95.1
96.2
98 -
-
-
- 96.7
96.7
97.7
98 90
90
91
97 -
-
-
- 68.5
68.5
80.6
- 30.3
30.3
48.8
- 84.4
84.4
91.8
85 27.6
27.6
42.7
77 -
-
-
- -
-
-
- -
-
-
- 38.8
38.8
49.9
- -
-
-
- -
-
-
- -
-
-
- -
-
-
- 26.5
26.5
44.2
- 27.5
27.5
45.6
- -
-
-
-
For a wider analysis go to PhosphoNET Evolution in PhosphoNET
Binding Proteins
Examples of known interacting proteins
hiddentext
| No. | Name – UniProt ID |
|---|---|
| 1 | YWHAZ - P63104 |
| 2 | STK11 - Q15831 |
| 3 | DVL3 - Q92997 |
| 4 | YWHAB - P31946 |
| 5 | GSK3B - P49841 |
| 6 | NUAK1 - O60285 |
| 7 | YWHAE - P62258 |
| 8 | PARD6A - Q9NPB6 |
| 9 | YWHAH - Q04917 |
| 10 | YWHAQ - P27348 |
Regulation
Activation:
Activated by phosphorylation on Thr-208 by STK11 in complex with STE20-related adapter-alpha (STRAD alpha) pseudo kinase and CAB39.
Inhibition:
NA
Synthesis:
NA
Degradation:
NA
Known Upstream Kinases
For further details on these substrates click on the Substrate Short Name or UniProt ID. Phosphosite Location is hyperlinked to PhosphoNET
predictions.
Based on in vitro and/or in vivo phosphorylation data
| Kinase Short Name | UniProt ID (Human) | Phosphosite Location | Phosphosite Sequence | Effect of Phosphorylation |
|---|
| LKB1 | Q15831 | T208 | TFGNKLDTFCGSPPY | + |
| TAO1 | Q7L7X3 | T208 | TFGNKLDTFCGSPPY | + |
| GSK3B | P49841 | S212 | KLDTFCGSPPYAAPE | - |
| MARK2 | Q7KZI7 | S400 | HKVQRSVSANPKQRR | ? |
| PKD1 | Q15139 | S400 | HKVQRSVSANPKQRR | ? |
| PKD2 | Q9BZL6 | S400 | HKVQRSVSANPKQRR | ? |
| ERK1 | P27361 | S456 | STAKVPASPLPGLER | |
| PKCi | P41743 | T596 | RGVSSRSTFHAGQLR | - |
| PKCz | Q05513 | T596 | RGVSSRSTFHAGQLR | - |
| ERK1 | P27361 | S619 | PYGVTPASPSGHSQG |
Known Downstream Substrates
For further details on these substrates click on the Substrate Short Name or UniProt ID. Phosphosite Location is hyperlinked to PhosphoNET
predictions.
Based on in vitro and/or in vivo phosphorylation data
| Substrate Short Name | UniProt ID (Human) | Phosphosite Location | Phosphosite Sequence | Effect of Phosphorylation |
|---|
| HDAC4 | P56524 | S246 | FPLRKTASEPNLKLR | |
| HDAC5 | Q9UQL6 | S259 | FPLRKTASEPNLKVR | |
| HDAC7 | Q8WUI4 | S155 | FPLRKTVSEPNLKLR | - |
| MARK2 | Q7KZI7 | S400 | HKVQRSVSANPKQRR | ? |
| Rab11FIP2 | Q7L804 | S227 | QRLSSAHSMSDLSGS | ? |
| Tau iso8 | P10636-8 | S262 | NVKSKIGSTENLKHQ | |
| Tau iso8 | P10636-8 | S293 | NVQSKCGSKDNIKHV | |
| Tau iso8 | P10636-8 | S324 | KVTSKCGSLGNIHHK | |
| Tau iso8 | P10636-8 | S356 | RVQSKIGSLDNITHV | |
| TORC2 (CRTC2) | Q53ET0 | S274 | PAMNTGGSLPDLTNL |
Protein Kinase Specificity
Matrix of observed frequency (%) of amino acids in aligned protein substrate phosphosites
Matrix Type:
Predicted from the application of the Kinexus Kinase Substrate Predictor Version 2.0 algorithm, which was trained with over 10,000 kinase-protein substrate pairs and 8,000 kinase-peptide substrate pairs.
Domain #:
1
Inhibitors
For further details on these inhibitors click on the Compound Name and enter it into DrugKiNET or click on the ID's
Based on in vitro and/or in vivo phosphorylation data
| Compound Name | KD, Ki or IC50 (nM) | PubChem ID | ChEMBL ID | PubMed ID |
|---|
Disease Linkage
General Disease Association:
Neurological disorders
Specific Diseases (Non-cancerous):
Alzheimer's disease (AD)
Comments:
Alzheimer’s disease had a positive correlation with increased Mark2-tau complexes, leading to increased tau phosphorylation (on S262).
Gene Expression in Cancers:
TranscriptoNET (www.transcriptonet.ca) analysis with mRNA expression data retrieved from the National Center for Biotechnology Information's Gene Expression Omnibus (GEO) database, which was normalized against 60 abundantly and commonly found proteins, indicated altered expression for this protein kinase as shown here as the percent change from normal tissue controls (%CFC) as supported with the Student T-test in human Bladder carcinomas (%CFC= +45, p<0.003). The COSMIC website notes an up-regulated expression score for MARK2 in diverse human cancers of 464, which is close to the average score of 462 for the human protein kinases. The down-regulated expression score of 136 for this protein kinase in human cancers was 2.3-fold of the average score of 60 for the human protein kinases.
Mutagenesis Experiments:
Insertional mutagenesis studies in mice support a role for this protein kinase in mouse cancer oncogenesis. The phosphorylation of MARK2 by the LKB can occur with a T208A mutation in MARK2. The ability of MARK2 to bind the 14-3-3 protein YWHAZ and to dissociate from the membrane can also stil occur with a T596A mutation.
Mutation Rate in All Cancers:
Percent mutation rates per 100 amino acids length in human cancers: 0.08 % in 25158 diverse cancer specimens. This rate is very similar (+ 5% higher) to the average rate of 0.075 % calculated for human protein kinases in general.
Mutation Rate in Specific Cancers:
Highest percent mutation rates per 100 amino acids length in human cancers: 0.32 % in 1270 large intestine cancers tested; 0.28 % in 864 skin cancers tested; 0.28 % in 589 stomach cancers tested; 0.21 % in 548 urinary tract cancers tested; 0.14 % in 273 cervix cancers tested; 0.14 % in 1634 lung cancers tested; 0.11 % in 710 oesophagus cancers tested; 0.11 % in 603 endometrium cancers tested; 0.09 % in 1512 liver cancers tested; 0.08 % in 939 prostate cancers tested; 0.07 % in 1467 pancreas cancers tested; 0.05 % in 1490 breast cancers tested; 0.05 % in 1276 kidney cancers tested; 0.04 % in 2082 central nervous system cancers tested; 0.03 % in 891 ovary cancers tested; 0.03 % in 441 autonomic ganglia cancers tested; 0.02 % in 558 thyroid cancers tested; 0.01 % in 942 upper aerodigestive tract cancers tested; 0.01 % in 2009 haematopoietic and lymphoid cancers tested.
Frequency of Mutated Sites:
None > 3 in 20,441 cancer specimens
Comments:
Only 6 deletions, 2 insertions and no complex mutations are noted on the COSMIC website.