
Nomenclature
Short Name:
IRAK1
Full Name:
Interleukin-1 receptor-associated kinase 1
Alias:
- EC 2.7.11.1
- MPLK
- Pelle
- Pelle-like protein kinase
- IL1RAK
- IRAK
- IRAK-1
- Kinase IRAK1
Classification
Type:
Protein-serine/threonine kinase
Group:
TKL
Family:
IRAK
SubFamily:
NA

Specific Links
Structure
Mol. Mass (Da):
76,537
# Amino Acids:
712
# mRNA Isoforms:
4
mRNA Isoforms:
76,537 Da (712 AA; P51617); 74,560 Da (693 AA; P51617-3); 73,421 Da (682 AA; P51617-2); 68,022 Da (633 AA; P51617-4)
4D Structure:
IL-1 stimulation leads to the formation of a signaling complex which dissociates from the IL-1 receptor following the binding of PELI1. Interacts with IL1RL1. Interacts with IRAK1BP1
1D Structure:
Subfamily Alignment
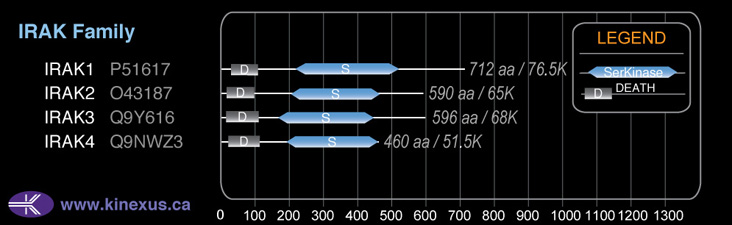
Domain Distribution:
Kinexus Products
Click on entries below for direct links to relevant products from Kinexus for this protein kinase.
hiddentext
Post-translation Modifications
For detailed information on phosphorylation of this kinase go to PhosphoNET
Acetylated:
K239.
Serine phosphorylated:
S131, S144, S173, S371+, S373, S375, S376+, S556, S568, S601, S650, S653.
Threonine phosphorylated:
T66, T100, T209+, T387+, T605.
Tyrosine phosphorylated:
Y515.
Ubiquitinated:
K134, K180, K253, K342, K355, K397.
Distribution
Based on gene microarray analysis from the NCBI
Human Tissue Distribution
% Max Expression:
Mean Expression:
Number of Samples:
Standard Deviation:
% Max Expression:
Mean Expression:
Number of Samples:
Standard Deviation:
 73
73
1875
22
1479
 11
11
287
11
273
 7
7
172
14
184
 38
38
979
86
2188
 44
44
1134
21
738
 16
16
401
52
369
 13
13
340
29
465
 76
76
1963
38
3766
 35
35
907
10
757
 9
9
229
58
152
 7
7
171
27
176
 39
39
1009
124
1067
 10
10
247
25
155
 3
3
84
9
112
 8
8
206
24
202
 12
12
317
13
250
 7
7
172
119
105
 8
8
200
21
228
 7
7
169
56
117
 32
32
838
79
646
 6
6
154
23
156
 8
8
207
25
229
 10
10
269
23
223
 7
7
192
21
271
 8
8
196
23
178
 74
74
1916
60
3749
 9
9
244
28
179
 6
6
166
21
178
 5
5
123
21
138
 2
2
46
14
15
 51
51
1308
18
755
 100
100
2586
26
4345
 26
26
665
62
868
 42
42
1088
57
742
 9
9
233
35
277
Evolution
Species Conservation
PhosphoNET % Identity:
PhosphoNET % Similarity:
Homologene %
Identity:
PhosphoNET % Identity:
PhosphoNET % Similarity:
Homologene %
Identity:
 100
100
100
100 77.2
77.2
78.9
99 -
-
-
- -
-
-
82 -
-
-
- 83.1
83.1
87.8
84 -
-
-
- 81
81
85.3
81 27.7
27.7
44.9
81 -
-
-
- 49.4
49.4
59.1
- -
-
-
- -
-
-
49 36.4
36.4
52.5
46 -
-
-
- -
-
-
- -
-
-
- -
-
-
- -
-
-
- 23.9
23.9
33
- 25.8
25.8
36.2
- -
-
-
32 22.9
22.9
35.4
42.5 -
-
-
- -
-
-
-
For a wider analysis go to PhosphoNET Evolution in PhosphoNET
Binding Proteins
Examples of known interacting proteins
hiddentext
| No. | Name – UniProt ID |
|---|---|
| 1 | PELI2 - Q9HAT8 |
| 2 | PELI3 - Q8N2H9 |
| 3 | IL1R1 - P14778 |
| 4 | FADD - Q13158 |
| 5 | TLR2 - O60603 |
| 6 | PRKCI - P41743 |
| 7 | NLRP12 - P59046 |
| 8 | RIPK2 - O43353 |
| 9 | IL1RAP - Q9NPH3 |
| 10 | STAT3 - P40763 |
| 11 | AKT1 - P31749 |
| 12 | SUMO1 - P63165 |
| 13 | ITGAM - P11215 |
| 14 | BTK - Q06187 |
| 15 | TRAF4 - Q9BUZ4 |
Regulation
Activation:
NA
Inhibition:
NA
Synthesis:
NA
Degradation:
NA
Known Upstream Kinases
For further details on these substrates click on the Substrate Short Name or UniProt ID. Phosphosite Location is hyperlinked to PhosphoNET
predictions.
Based on in vitro and/or in vivo phosphorylation data
| Kinase Short Name | UniProt ID (Human) | Phosphosite Location | Phosphosite Sequence | Effect of Phosphorylation |
|---|
Known Downstream Substrates
For further details on these substrates click on the Substrate Short Name or UniProt ID. Phosphosite Location is hyperlinked to PhosphoNET
predictions.
Based on in vitro and/or in vivo phosphorylation data
| Substrate Short Name | UniProt ID (Human) | Phosphosite Location | Phosphosite Sequence | Effect of Phosphorylation |
|---|
| IRAK1 | P51617 | T209 | LCEISRGTHNFSEEL | + |
| IRAK1 | P51617 | T387 | RTQTVRGTLAYLPEE | + |
| PELI1 | Q96FA3 | S293 | FNTLAFPSMKRKDVV | + |
| PELI1 | Q96FA3 | S70 | PQAAKAISNKDQHSI | |
| PELI1 | Q96FA3 | S76 | ISNKDQHSISYTLSR | + |
| PELI1 | Q96FA3 | S78 | NKDQHSISYTLSRAQ | + |
| PELI1 | Q96FA3 | S82 | HSISYTLSRAQTVVV | + |
| PELI1 | Q96FA3 | T127 | GSQSNSDTQSVQSTI | |
| PELI1 | Q96FA3 | T288 | QCPVGFNTLAFPSMK | + |
| PELI1 | Q96FA3 | T80 | DQHSISYTLSRAQTV | + |
| PELI1 | Q96FA3 | T86 | YTLSRAQTVVVEYTH | + |
| PELI2 | Q9HAT8 | T290 | QCPVGLNTLAFPSIN | + |
| STAT3 | P40763 | S727 | NTIDLPMSPRTLDSL | - |
Protein Kinase Specificity
Matrix of observed frequency (%) of amino acids in aligned protein substrate phosphosites
Matrix Type:
Experimentally derived from alignment of 26 known protein substrate phosphosites.
Domain #:
1
Inhibitors
For further details on these inhibitors click on the Compound Name and enter it into DrugKiNET or click on the ID's
Based on in vitro and/or in vivo phosphorylation data
| Compound Name | KD, Ki or IC50 (nM) | PubChem ID | ChEMBL ID | PubMed ID |
|---|
Disease Linkage
General Disease Association:
Autoimmune disorders
Specific Diseases (Non-cancerous):
Systemic lupus erythematosus (SLE); Pediatric Systemic lupus erythematosus (SLE)
Comments:
Systemic Lupus Erythematosus (SLE) is a rare disorder that occurs when there is an autoimmune response that can attack joints, skin, blood vessels, or organs resulting in systemic inflammation. Pediatric Systemic Lupus Erythematosus is a rare disorder related to SLE, and it can affect bone, spinal cord, or B cell tissues. Autophosphorylation of IRAK1 can be inhibited with a T209A mutation and full loss of kinase phosphotransferase activity is lost with K239S or T387A mutations.
Gene Expression in Cancers:
TranscriptoNET (www.transcriptonet.ca) analysis with mRNA expression data retrieved from the National Center for Biotechnology Information's Gene Expression Omnibus (GEO) database, which was normalized against 60 abundantly and commonly found proteins, indicated altered expression for this protein kinase as shown here as the percent change from normal tissue controls (%CFC) as supported with the Student T-test in the following types of human cancers: Bladder carcinomas (%CFC= +83, p<0.003); Brain glioblastomas (%CFC= -78, p<0.0001); Classical Hodgkin lymphomas (%CFC= +126, p<0.036); Colon mucosal cell adenomas (%CFC= +66, p<0.002); Gastric cancer (%CFC= +63, p<0.0002); Large B-cell lymphomas (%CFC= +270, p<0.014); Lung adenocarcinomas (%CFC= +171, p<0.0001); Malignant pleural mesotheliomas (MPM) tumours (%CFC= +93, p<0.0001); Ovary adenocarcinomas (%CFC= +299, p<0.027); Skin squamous cell carcinomas (%CFC= +63, p<0.078); and Uterine leiomyomas (%CFC= +73, p<0.031). The COSMIC website notes an up-regulated expression score for IRAK1 in diverse human cancers of 1165, which is 2.5-fold of the average score of 462 for the human protein kinases. The down-regulated expression score of 170 for this protein kinase in human cancers was 2.8-fold of the average score of 60 for the human protein kinases.
Mutagenesis Experiments:
Insertional mutagenesis studies in mice have not yet revealed a role for this protein kinase in mouse cancer oncogenesis.
Mutation Rate in All Cancers:
Percent mutation rates per 100 amino acids length in human cancers: 0.05 % in 25533 diverse cancer specimens. This rate is only -29 % lower than the average rate of 0.075 % calculated for human protein kinases in general.
Mutation Rate in Specific Cancers:
Highest percent mutation rates per 100 amino acids length in human cancers: 0.2 % in 1270 large intestine cancers tested; 0.15 % in 864 skin cancers tested; 0.14 % in 589 stomach cancers tested; 0.12 % in 1956 lung cancers tested; 0.1 % in 273 cervix cancers tested; 0.09 % in 603 endometrium cancers tested; 0.07 % in 382 soft tissue cancers tested; 0.07 % in 1512 liver cancers tested; 0.06 % in 710 oesophagus cancers tested; 0.05 % in 891 ovary cancers tested; 0.05 % in 1546 breast cancers tested; 0.03 % in 958 upper aerodigestive tract cancers tested; 0.03 % in 558 thyroid cancers tested; 0.03 % in 548 urinary tract cancers tested; 0.03 % in 1467 pancreas cancers tested; 0.03 % in 1276 kidney cancers tested; 0.02 % in 2103 central nervous system cancers tested; 0.01 % in 939 prostate cancers tested; 0.01 % in 2094 haematopoietic and lymphoid cancers tested.
Frequency of Mutated Sites:
None > 3 in 20,732 cancer specimens
Comments:
Only 3 deletions and 1 insertion, and no complex mutations are noted on the COSMIC website.