
Nomenclature
Short Name:
BTK
Full Name:
Tyrosine-protein kinase BTK
Alias:
- Agammaglobulinaemia tyrosine kinase
- AGMX1
- EC 2.7.10.2
- EMB
- IMD1
- XLA
- ATK
- B cell progenitor kinase
- BPK
- Bruton agammaglobulinemia tyrosine kinase
Classification
Type:
Protein-tyrosine kinase
Group:
TK
Family:
Tec
SubFamily:
NA

Specific Links
Structure
Mol. Mass (Da):
76,281
# Amino Acids:
659
# mRNA Isoforms:
2
mRNA Isoforms:
79,937 Da (693 AA; Q06187-2); 76,281 Da (659 AA; Q06187)
4D Structure:
Binds GTF2I through the PH domain. Interacts with SH3BP5 via the SH3 domain. Interacts with IBTK via its PH domain. Interacts with GTF2I and ARID3A.
1D Structure:
3D Image (rendered using PV Viewer):
PDB ID
Subfamily Alignment
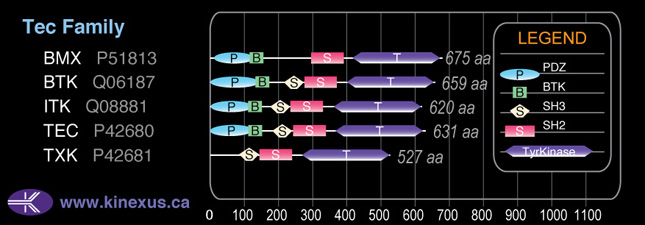
Domain Distribution:
Kinexus Products
Click on entries below for direct links to relevant products from Kinexus for this protein kinase.
hiddentext
Post-translation Modifications
For detailed information on phosphorylation of this kinase go to PhosphoNET
Acetylated:
A2,K183.
Serine phosphorylated:
S21, S51, S55, S93, S179, S180-, S318, S342, S366, S371, S378, S543, S553+, S564, S604, S659.
Threonine phosphorylated:
T184, T191, T495, T552, T602 .
Tyrosine phosphorylated:
Y40, Y223+, Y225, Y263, Y279, Y334, Y344, Y345, Y361, Y375, Y461, Y511, Y551+, Y617.
Ubiquitinated:
K300, K322, K406, K466, K536, K558.
Distribution
Based on gene microarray analysis from the NCBI
Human Tissue Distribution
% Max Expression:
Mean Expression:
Number of Samples:
Standard Deviation:
% Max Expression:
Mean Expression:
Number of Samples:
Standard Deviation:
 84
84
955
16
1220
 2
2
23
10
19
 7
7
77
19
69
 36
36
407
66
1031
 50
50
567
14
577
 3
3
37
42
57
 24
24
268
19
487
 55
55
624
39
1806
 22
22
253
10
233
 4
4
44
47
46
 3
3
39
34
36
 53
53
601
125
923
 28
28
313
30
259
 1.2
1.2
14
8
10
 4
4
40
30
50
 1.2
1.2
14
8
11
 7
7
82
120
575
 7
7
76
26
79
 2
2
26
61
17
 37
37
418
56
460
 8
8
96
30
86
 26
26
291
32
274
 48
48
545
28
2451
 2
2
26
26
29
 8
8
87
30
82
 84
84
954
44
2450
 29
29
329
33
296
 59
59
664
26
3058
 4
4
45
26
47
 11
11
127
14
68
 65
65
738
18
526
 62
62
700
21
811
 21
21
238
51
500
 100
100
1134
31
917
 3
3
29
22
23
Evolution
Species Conservation
PhosphoNET % Identity:
PhosphoNET % Similarity:
Homologene %
Identity:
PhosphoNET % Identity:
PhosphoNET % Similarity:
Homologene %
Identity:
 100
100
100
100 99.8
99.8
100
100 54.5
54.5
71.9
99 -
-
-
99 -
-
-
99 98.9
98.9
99.7
99 -
-
-
- 98.3
98.3
99.8
98 31.3
31.3
48.7
98 -
-
-
- 93
93
97
- 85.6
85.6
93.5
86 32.6
32.6
47.6
74 63.4
63.4
78.5
65 -
-
-
- 38.9
38.9
52.9
- -
-
-
- -
-
-
- -
-
-
- -
-
-
- -
-
-
- -
-
-
- -
-
-
- -
-
-
- -
-
-
-
For a wider analysis go to PhosphoNET Evolution in PhosphoNET
Binding Proteins
Examples of known interacting proteins
hiddentext
| No. | Name – UniProt ID |
|---|---|
| 1 | BLNK - Q8WV28 |
| 2 | GTF2I - P78347 |
| 3 | PLCG2 - P16885 |
| 4 | PRKCB - P05771 |
| 5 | SH3BP5 - O60239 |
| 6 | CBL - P22681 |
| 7 | WAS - P42768 |
| 8 | CD19 - P15391 |
| 9 | FCER1G - P30273 |
| 10 | PRKD1 - Q15139 |
| 11 | WASF4 - Q8IV90 |
| 12 | PRKCQ - Q04759 |
| 13 | ARID3A - Q99856 |
| 14 | STAT5A - P42229 |
| 15 | GNAQ - P50148 |
Regulation
Activation:
Phosphorylation at Tyr-223 and Tyr-551 increases phosphotransferase activity.
Inhibition:
Inhibited by IBTK. Phosphorylation of Ser-180 inhibits tyrosine phosphorylation and membrane association of Btk.
Synthesis:
NA
Degradation:
NA
Known Upstream Kinases
For further details on these substrates click on the Substrate Short Name or UniProt ID. Phosphosite Location is hyperlinked to PhosphoNET
predictions.
Based on in vitro and/or in vivo phosphorylation data
| Kinase Short Name | UniProt ID (Human) | Phosphosite Location | Phosphosite Sequence | Effect of Phosphorylation |
|---|
| PKCb | P05771 | S180 | GSLKPGSSHRKTKKP | - |
| LYN | P07948 | Y223 | LKKVVALYDYMPMNA | + |
| TEC | P42680 | Y223 | LKKVVALYDYMPMNA | + |
| ITK | Q08881 | Y223 | LKKVVALYDYMPMNA | + |
| PIK3CD | O00329 | Y223 | LKKVVALYDYMPMNA | + |
| BTK | Q06187 | Y223 | LKKVVALYDYMPMNA | + |
| ABL | P00519 | Y223 | LKKVVALYDYMPMNA | + |
| BTK | Q06187 | Y375 | GLISRLKYPVSQQNK | |
| LYN | P07948 | Y551 | RYVLDDEYTSSVGSK | + |
| SRC | P12931 | Y551 | RYVLDDEYTSSVGSK | + |
| SYK | P43405 | Y551 | RYVLDDEYTSSVGSK | + |
| PIK3CD | O00329 | Y551 | RYVLDDEYTSSVGSK | + |
| BTK | Q06187 | Y551 | RYVLDDEYTSSVGSK | + |
| BTK | Q06187 | Y617 | IAQGLRLYRPHLASE |
Known Downstream Substrates
For further details on these substrates click on the Substrate Short Name or UniProt ID. Phosphosite Location is hyperlinked to PhosphoNET
predictions.
Based on in vitro and/or in vivo phosphorylation data
| Substrate Short Name | UniProt ID (Human) | Phosphosite Location | Phosphosite Sequence | Effect of Phosphorylation |
|---|
| Bmx (Etk) | P51813 | Y216 | SSTSLAQYDSNSKKI | |
| Btk | Q06187 | Y223 | LKKVVALYDYMPMNA | + |
| Btk | Q06187 | Y375 | GLISRLKYPVSQQNK | |
| Btk | Q06187 | Y551 | RYVLDDEYTSSVGSK | + |
| Btk | Q06187 | Y617 | IAQGLRLYRPHLASE | |
| CREB1 | P16220 | S133 | EILSRRPSYRKILND | + |
| GTF2I | P78347 | Y248 | EESEDPDYYQYNIQG | |
| GTF2I | P78347 | Y398 | QSHVEDLYVEGLPEG | |
| GTF2I | P78347 | Y503 | EAHPNDLYVEGLPEN | |
| Itk | Q08881 | Y180 | ETVVIALYDYQTNDP | |
| PIK3AP1 (BCAP) | Q6ZUJ8 | Y195 | CGAETTVYVIVRCKL | |
| PIK3AP1 (BCAP) | Q6ZUJ8 | Y419 | GEEADAVYESMAHLS | |
| PIK3AP1 (BCAP) | Q6ZUJ8 | Y444 | PGCDEDLYESMAAFV | |
| PIK3AP1 (BCAP) | Q6ZUJ8 | Y459 | PAATEDLYVEMLQAS | |
| PLCG2 | P16885 | Y1197 | LESEEELYSSCRQLR | |
| PLCG2 | P16885 | Y1217 | LNNQLFLYDTHQNLR | |
| PLCG2 | P16885 | Y753 | ERDINSLYDVSRMYV | + |
| PLCG2 | P16885 | Y759 | LYDVSRMYVDPSEIN | + |
| STAT5A | P42229 | Y694 | LAKAVDGYVKPQIKQ | + |
| TEC | P42680 | Y206 | RLERGQEYLILEKND | |
| TIRAP | P58753 | Y106 | AAQDLVSYLEGSTAS | |
| TIRAP | P58753 | Y187 | SGLSRAAYPPELRFM | |
| TIRAP | P58753 | Y86 | SSRWSKDYDVCVCHS | |
| WASP | P42768 | Y291 | AETSKLIYDFIEDQG | + |
Protein Kinase Specificity
Matrix of observed frequency (%) of amino acids in aligned protein substrate phosphosites
Matrix Type:
Experimentally derived from alignment of 31 known protein substrate phosphosites.
Domain #:
1
Inhibitors
For further details on these inhibitors click on the Compound Name and enter it into DrugKiNET or click on the ID's
Based on in vitro and/or in vivo phosphorylation data
| Compound Name | KD, Ki or IC50 (nM) | PubChem ID | ChEMBL ID | PubMed ID |
|---|
Disease Linkage
General Disease Association:
Immune disorders
Specific Diseases (Non-cancerous):
Agammaglobulinemia, X-linked 1; Bruton-Type agammaglobulinemia; Agammaglobulinemia; Wiskott-Aldrich syndrome; Growth hormone deficiency; Isolated growth hormone deficiency; Agammaglobulinemia and isolated hormone deficiency; Poliomyelitis; B-cell deficiency; Paralytic poliomyelitis; Fabry disease; Isolated growth hormone deficiency Type 3
Comments:
Agammaglobulinemia is a humoral immunodeficiency disease characterized by the defective development and maturation of B-cells. Affected individuals have very low (if not complete absent) levels of circulating B-cells, resulting in the complete absence of all classes of immunoglobulins in their body. As a result, patients with this disease suffer from chronic bacterial infections like otitis, conjunctivitis, dermatitis, sinusitis, and even sepsis and meningitits. Treatment for this disease is usually through the intravenous infusion of immunoglobins. Numerous loss-of-function mutations in the BTK gene have been observed in agammaglobulinemia patients, and are thought to be the cause of the failed B-cell maturation in this disease. About 80-90% of males with X-linked ammaglobulinemia have mutations in the BTK gene. In total, 544 unique mutations spread across all 5 domains of the BTK protein have been reported with an association to agammaglobulinemia, with the most common being missense mutations. Most of the observed mutations result in premature translational termination leading to truncation of the BTK protein product. Interestingly, around one-third of the observed point mutations were located in CpG sites forming arginine residues. In animal studies, introduction of BTK protein from the pre-B cell stage onwards in BTK-deficient mice effectively rescued the immunodeficient phenotype, restoring the maturation of B-cells, normal serum immunoglobulin levels, and a normal in vivo immune response to introduced pathogens.
Gene Expression in Cancers:
TranscriptoNET (www.transcriptonet.ca) analysis with mRNA expression data retrieved from the National Center for Biotechnology Information's Gene Expression Omnibus (GEO) database, which was normalized against 60 abundantly and commonly found proteins, indicated altered expression for this protein kinase as shown here as the percent change from normal tissue controls (%CFC) as supported with the Student T-test in the following types of human cancers: Bladder carcinomas (%CFC= -48, p<0.002); Brain glioblastomas (%CFC= -87, p<0.031); Cervical cancer stage 1B (%CFC= +258, p<0.003); Cervical cancer stage 2A (%CFC= +110, p<0.066); Cervical cancer stage 2B (%CFC= +313, p<0.066); and Colon mucosal cell adenomas (%CFC= -70, p<0.0001); The COSMIC website notes an up-regulated expression score for BTK in diverse human cancers of 494, which is 1.1-fold of the average score of 462 for the human protein kinases. The down-regulated expression score of 113 for this protein kinase in human cancers was 1.9-fold of the average score of 60 for the human protein kinases.
Mutagenesis Experiments:
Insertional mutagenesis studies in mice have not yet revealed a role for this protein kinase in mouse cancer oncogenesis.
Mutation Rate in All Cancers:
Percent mutation rates per 100 amino acids length in human cancers: 0.1 % in 25448 diverse cancer specimens. This rate is only 29 % higher than the average rate of 0.075 % calculated for human protein kinases in general.
Mutation Rate in Specific Cancers:
Highest percent mutation rates per 100 amino acids length in human cancers: 0.47 % in 805 skin cancers tested; 0.35 % in 1093 large intestine cancers tested; 0.33 % in 602 endometrium cancers tested; 0.24 % in 1941 lung cancers tested; 0.1 % in 1466 breast cancers tested.
Frequency of Mutated Sites:
None > 4 in 20,629 cancer specimens
Comments:
Only 1 deletion, and no insertions or complex mutations are noted on the COSMIC website.