
Nomenclature
Short Name:
FAK
Full Name:
Focal adhesion kinase 1
Alias:
- EC 2.7.10.2
- PTK2
- FADK1
- FAK1
- pp125FAK
- FRNK
- Protein-tyrosine kinase 2
Classification
Type:
Protein-tyrosine kinase
Group:
TK
Family:
Fak
SubFamily:
NA

Specific Links
Structure
Mol. Mass (Da):
119,233
# Amino Acids:
1052
# mRNA Isoforms:
7
mRNA Isoforms:
120,900 Da (1065 AA; Q05397-5); 119,233 Da (1052 AA; Q05397); 114,253 Da (1006 AA; Q05397-7); 99,358 Da (879 AA; Q05397-2); 63,201 Da (554 AA; Q05397-3); 48,967 Da (431 AA; Q05397-4); 39,874 Da (360 AA; Q05397-6)
4D Structure:
Interacts with CAS family members and with GIT1, SORBS1 and BCAR3. Interacts with RGNEF and SHB By similarity. Interacts with TGFB1I1 and STEAP4
1D Structure:
3D Image (rendered using PV Viewer):
PDB ID
Subfamily Alignment
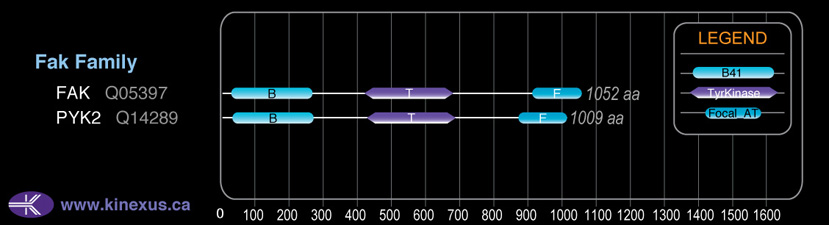
Domain Distribution:
Kinexus Products
Click on entries below for direct links to relevant products from Kinexus for this protein kinase.
hiddentext
Post-translation Modifications
For detailed information on phosphorylation of this kinase go to PhosphoNET
Acetylated:
A2, K467, K1017.
Other:
Glycyl lysine isopeptide (Lys-Gly) (interchain with G-Cter in SUMO) linked to K152.
Serine phosphorylated:
S16, S29, S54, S390, S392, S443, S461, S463, S517, S568+, S574+, S580+, S677, S695, S702, S705, S708, S722-, S726, S732, S759, S840, S843, S850, S887, S893, S910, S920.
Threonine phosphorylated:
T13, T386, T394, T406, T408, T460, T503, T575+, T700, T805, T914, T929, T967, T971.
Tyrosine phosphorylated:
Y5, Y148, Y155, Y194+, Y347, Y397+, Y407+, Y441, Y570+, Y576+, Y577+, Y720, Y742, Y761, Y861+, Y898, Y925+, Y1007.
Ubiquitinated:
K1000.
Distribution
Based on gene microarray analysis from the NCBI
Human Tissue Distribution
% Max Expression:
Mean Expression:
Number of Samples:
Standard Deviation:
% Max Expression:
Mean Expression:
Number of Samples:
Standard Deviation:
 100
100
1142
44
1015
 15
15
168
19
92
 52
52
593
9
536
 63
63
718
146
736
 80
80
910
42
684
 43
43
489
106
1275
 24
24
270
55
426
 50
50
566
45
637
 72
72
818
17
587
 16
16
184
122
214
 13
13
152
36
257
 69
69
788
188
720
 14
14
164
31
244
 14
14
156
15
76
 11
11
124
23
54
 12
12
141
26
131
 22
22
248
278
2049
 70
70
794
20
2456
 12
12
135
122
108
 67
67
767
160
664
 50
50
572
28
679
 15
15
172
32
249
 47
47
537
11
509
 44
44
497
20
873
 11
11
125
28
234
 72
72
818
88
691
 18
18
207
34
345
 39
39
447
20
755
 39
39
449
20
566
 9
9
100
42
104
 60
60
689
24
677
 44
44
497
46
557
 36
36
410
96
842
 65
65
741
104
623
 23
23
259
70
354
Evolution
Species Conservation
PhosphoNET % Identity:
PhosphoNET % Similarity:
Homologene %
Identity:
PhosphoNET % Identity:
PhosphoNET % Similarity:
Homologene %
Identity:
 100
100
100
100 95.8
95.8
95.8
100 93.3
93.3
93.8
99 -
-
-
96 -
-
-
95 95.4
95.4
97.1
97 -
-
-
- 93.8
93.8
95.1
97 96.7
96.7
98.6
97 -
-
-
- 92.6
92.6
95.4
- 94.7
94.7
97.6
95 88.8
88.8
93.9
91 20.7
20.7
31.6
83 -
-
-
- -
-
-
43 37.6
37.6
54.9
- -
-
-
37 -
-
-
- -
-
-
- -
-
-
- -
-
-
- -
-
-
- -
-
-
- -
-
-
-
For a wider analysis go to PhosphoNET Evolution in PhosphoNET
Binding Proteins
Examples of known interacting proteins
hiddentext
| No. | Name – UniProt ID |
|---|---|
| 1 | BCAR1 - P56945 |
| 2 | PXN - P49023 |
| 3 | GIT1 - Q9Y2X7 |
| 4 | ITGB3 - P05106 |
| 5 | CRK - P46108 |
| 6 | PIK3R1 - P27986 |
| 7 | NCK1 - P16333 |
| 8 | TLN1 - Q9Y490 |
| 9 | EGFR - P00533 |
| 10 | EFS - O43281 |
| 11 | DCC - P43146 |
| 12 | GRB7 - Q14451 |
| 13 | ITGB5 - P18084 |
| 14 | NCK2 - O43639 |
| 15 | CXCR4 - P61073 |
Regulation
Activation:
Phosphorylation of Thr-397 increases phosphotransferse activity, induces interaction with FAK and SOCS1, and inhibits interaction with PIK3R2 and Src. Phosphorylation of Tyr-576 and Tyr-577 increases phosphotransferase activity. Phosphorylation of Tyr-861 increases phosphotranserase activity and induces interaction with ITGB5 and p130 Cas. Phosphorylation of Tyr-925 induces interaction with Grb2.
Inhibition:
Phosphorylation at Ser-722 inhibits FAK binding to the adapter protein p130Cas.
Synthesis:
NA
Degradation:
NA
Known Upstream Kinases
For further details on these substrates click on the Substrate Short Name or UniProt ID. Phosphosite Location is hyperlinked to PhosphoNET
predictions.
Based on in vitro and/or in vivo phosphorylation data
| Kinase Short Name | UniProt ID (Human) | Phosphosite Location | Phosphosite Sequence | Effect of Phosphorylation |
|---|
| MET | P08581 | Y397 | SVSETDDYAEIIDEE | + |
| FAK | Q05397 | Y397 | SVSETDDYAEIIDEE | + |
| SRC | P12931 | Y397 | SVSETDDYAEIIDEE | + |
| FGR | P09769 | Y397 | SVSETDDYAEIIDEE | + |
| PYK2 | Q14289 | Y407 | IIDEEDTYTMPSTRD | + |
| MET | P08581 | Y407 | IIDEEDTYTMPSTRD | + |
| ROCK1 | Q13464 | Y407 | IIDEEDTYTMPSTRD | + |
| FAK | Q05397 | Y407 | IIDEEDTYTMPSTRD | + |
| SRC | P12931 | Y407 | IIDEEDTYTMPSTRD | + |
| MET | P08581 | Y576 | RYMEDSTYYKASKGK | + |
| FAK | Q05397 | Y576 | RYMEDSTYYKASKGK | + |
| SRC | P12931 | Y576 | RYMEDSTYYKASKGK | + |
| FGR | P09769 | Y576 | RYMEDSTYYKASKGK | + |
| MET | P08581 | Y577 | YMEDSTYYKASKGKL | + |
| FER | P16591 | Y577 | YMEDSTYYKASKGKL | + |
| FAK | Q05397 | Y577 | YMEDSTYYKASKGKL | + |
| SRC | P12931 | Y577 | YMEDSTYYKASKGKL | + |
| CDK1 | P06493 | S722 | PSRPGYPSPRSSEGF | - |
| GSK3B | P49841 | S722 | PSRPGYPSPRSSEGF | - |
| CDK5 | Q00535 | S732 | SSEGFYPSPQHMVQT | ? |
| ROCK1 | Q13464 | S732 | SSEGFYPSPQHMVQT | ? |
| PKACa | P17612 | S840 | LKPDVRLSRGSIDRE | |
| CK1a1 | P48729 | S843 | DVRLSRGSIDREDGS | |
| MET | P08581 | Y861 | PIGNQHIYQPVGKPD | + |
| FER | P16591 | Y861 | PIGNQHIYQPVGKPD | + |
| SRC | P12931 | Y861 | PIGNQHIYQPVGKPD | + |
| ERK2 | P28482 | S910 | KLQPQEISPPPTANL | ? |
| CDK5 | Q00535 | S910 | KLQPQEISPPPTANL | ? |
| ERK1 | P27361 | S910 | KLQPQEISPPPTANL | ? |
| MET | P08581 | Y925 | DRSNDKVYENVTGLV | + |
| FER | P16591 | Y925 | DRSNDKVYENVTGLV | + |
| SRC | P12931 | Y925 | DRSNDKVYENVTGLV | + |
| FGR | P09769 | Y925 | DRSNDKVYENVTGLV | + |
Known Downstream Substrates
For further details on these substrates click on the Substrate Short Name or UniProt ID. Phosphosite Location is hyperlinked to PhosphoNET
predictions.
Based on in vitro and/or in vivo phosphorylation data
| Substrate Short Name | UniProt ID (Human) | Phosphosite Location | Phosphosite Sequence | Effect of Phosphorylation |
|---|
| ACTN1 | P12814 | Y12 | DSQQTNDYMQPEEDW | |
| ARHGEF7 | Q14155 | Y620 | PAPLTPAYHTLPHPS | |
| ATP2B4 | P23634 | Y1212 | LDGEVTPYANTNNNA | |
| Cas-L | Q14511 | Y629 | ERSWMDDYDYVHLQG | |
| CDCP1 | Q9H5V8 | Y734 | KDNDSHVYAVIEDTM | |
| FAK (PTK2) | Q05397 | Y397 | SVSETDDYAEIIDEE | + |
| FAK (PTK2) | Q05397 | Y407 | IIDEEDTYTMPSTRD | + |
| FAK (PTK2) | Q05397 | Y576 | RYMEDSTYYKASKGK | + |
| FAK (PTK2) | Q05397 | Y577 | YMEDSTYYKASKGKL | + |
| GIT2 | Q14161 | Y286 | EELAMDVYDEVDRRE | |
| GIT2 | Q14161 | Y392 | QDNDQPDYDSVASDE | |
| GIT2 | Q14161 | Y592 | NSTPESDYDNTPNDM | |
| Grb7 | Q14451 | Y188 | FRKNFAKYELFKSSP | + |
| Grb7 | Q14451 | Y338 | AAFRLFKYGVQLYKN | + |
| ITGB7 | P26010 | Y753 | YRLSVEIYDRREYSR | |
| ITGB7 | P26010 | Y758 | EIYDRREYSRFEKEQ | |
| N-WASP (WAS-L) | O00401 | Y256 | RETSKVIYDFIEKTG | |
| P130Cas (BCAR1) | P56945 | Y165 | PSPATDLYQVPPGPG | |
| P130Cas (BCAR1) | P56945 | Y664 | EGGWMEDYDYVHLQG | |
| P130Cas (BCAR1) | P56945 | Y666 | GWMEDYDYVHLQGKE | |
| PXN | P49023 | Y118 | VGEEEHVYSFPNKQK | |
| PXN | P49023 | Y31 | FLSEETPYSYPTGNH | |
| Ret | P07949 | Y905 | DVYEEDSYVKRSQGR | + |
| SH3GL1 | Q99961 | Y315 | QPSCKALYDFEPEND | |
| Shc1 | P29353 | Y427 | ELFDDPSYVNVQNLD | ? |
| Src | P12931 | Y419 | RLIEDNEYTARQGAK | + |
Protein Kinase Specificity
Matrix of observed frequency (%) of amino acids in aligned protein substrate phosphosites
Matrix Type:
Experimentally derived from alignment of 22 known protein substrate phosphosites and 22 peptides phosphorylated by recombinant FAK in vitro tested in-house by Kinexus.
Domain #:
1
Inhibitors
For further details on these inhibitors click on the Compound Name and enter it into DrugKiNET or click on the ID's
Based on in vitro and/or in vivo phosphorylation data
| Compound Name | KD, Ki or IC50 (nM) | PubChem ID | ChEMBL ID | PubMed ID |
|---|
Disease Linkage
General Disease Association:
Cancer, skin disorders
Specific Diseases (Non-cancerous):
Scar contracture
Comments:
Scar contracture is a skin condition resulting from second or third degree burn, in which the skin around the burn pulls together and tightens, leading to scar formation and restriction in movement in the area surrounding the injured skin. In mouse and human fibroblasts, FAK expression is necessary for scar formation after wounding. In addition, significantly elevated levels of FAK protein expression was observed in a mouse model of hypertrophic scar formation after cutaneous injury, and mice lacking FAK expression displayed reduced scarring after injury. The downstream targets of FAK activity, MCP-1 and ERK, are also required for scar formation, indicating a key role for FAK signalling in scar formation. In addition, It has been shown that the FAK gene is activated after cutaneous injury and that the activation process is potentiated by the application of mechanical force. Mechanical force acting on tissue regulates cell- extracellular matrix interactions that are mediated through intracellular components of focal adhesions, one of which is the FAK protein. In addition, FAK has been shown to act through the extracellular-regulated kinase (ERK) to stimulate the release of monocyte chemoattractant protein-1 (MCP-1), which is a potent inflammatory cytokine associated with various human fibrotic disorders. Small molecule inhibitors of the FAK protein have been shown to reduce scar formation in human tissues after injury through the reduction of MCP-1 signalling and impaired recruitment of inflammatory cells to the site of injury. Therefore, elevated levels of FAK expression in skin fibroblast after cutaneous injury may contribute to the pathology of scar contracture.
Specific Cancer Types:
Breast cancer; Gastroesophageal junction adenocarcinomas; Askin's tumours
Comments:
FAK appears to be an oncoprotein (OP). A role for FAK in cancer cell migration and motility has been demonstrated for several human cancer types. Knockdown of FAK expression in a human gastric adenocarinoma cell line resulted in the impairment of cancer cell spreading and elongation, confirming a key role for the FAK protein in the regulation of cancer cell motility and metastasis. The FAK gene has been mapped to chromosome 8 (8q24) and is linked to the MYC gene, a known oncogene. In animal studies, deletion of the FAK gene in mice prevented papilloma formation and inhibited the progression of malignancy in pre-formed benign tumors, indicating an oncogenic role for the FAK protein. Additionally, FAK gene deletion was associated with a reduction in keratinocyte migration and increased keratinocyte cell death. Therefore, FAK was concluded to modulate the formation of benign tumours and their subsequent malignant conversion. In 39 hepatocellular carcinoma (HCC) cell lines analyzed for copy number expression, increased copy number was observed at the FAK locus and correlated strongly with expression level of the FAK protein as well as an increased tumour size (>5 cm).
Gene Expression in Cancers:
TranscriptoNET (www.transcriptonet.ca) analysis with mRNA expression data retrieved from the National Center for Biotechnology Information's Gene Expression Omnibus (GEO) database, which was normalized against 60 abundantly and commonly found proteins, indicated altered expression for this protein kinase as shown here as the percent change from normal tissue controls (%CFC) as supported with the Student T-test in the following types of human cancers: Barrett's esophagus epithelial metaplasia (%CFC= +71, p<0.095); Bladder carcinomas (%CFC= +127, p<0.0001); Cervical cancer (%CFC= -60, p<0.0001); Clear cell renal cell carcinomas (cRCC) stage I (%CFC= -91, p<0.0001); Head and neck squamous cell carcinomas (HNSCC) (%CFC= +55, p<0.0007); Malignant pleural mesotheliomas (MPM) tumours (%CFC= +89, p<0.0005); Oral squamous cell carcinomas (OSCC) (%CFC= +66, p<0.008); and Prostate cancer - primary (%CFC= +94, p<0.0001).
Mutagenesis Experiments:
Insertional mutagenesis studies in mice have not yet revealed a role for this protein kinase in mouse cancer oncogenesis.
Mutation Rate in All Cancers:
Percent mutation rates per 100 amino acids length in human cancers: 0.07 % in 24930 diverse cancer specimens. This rate is only -7 % lower and is very similar to the average rate of 0.075 % calculated for human protein kinases in general.
Frequency of Mutated Sites:
Most frequent mutations with the number of reports indicated in brackets: F147S (3); F147L (2).
Comments:
Only 5 deletions, no insertions or complex mutations are noted on the COSMIC website.