
Nomenclature
Short Name:
eEF2K
Full Name:
Calcium/calmodulin-dependent eukaryotic elongation factor 2 kinase
Alias:
- EEF-2 kinase
- EEF-2K
- Elongation factor 2 kinase
- HSU93850
- MGC45041
Classification
Type:
Protein-serine/threonine kinase
Group:
Atypical
Family:
Alpha
SubFamily:
eEF2K

Structure
Mol. Mass (Da):
82144
# Amino Acids:
725
# mRNA Isoforms:
1
mRNA Isoforms:
82144 Da (725 AA; O00418)
4D Structure:
Monomer or homodimer
1D Structure:
3D Image (rendered using PV Viewer):
PDB ID
Subfamily Alignment
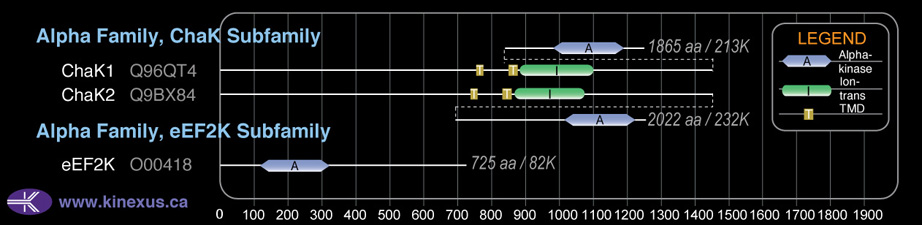
Domain Distribution:
| Start | End | Domain |
|---|---|---|
| 116 | 326 | Alpha_kinase |
Post-translation Modifications
For detailed information on phosphorylation of this kinase go to PhosphoNET
Serine phosphorylated:
S18, S27, S31, S61, S66, S70, S71, S72, S74, S78-, S135, S241, S243, S345, S359-, S366-, S377, S380, S386, S392, S395, S396, S398+, S399, S416, S435, S438, S441, S445, S470, S474, S477, S478, S491, S492, S500, S521, S627.
Threonine phosphorylated:
T340, T348, T353, T364, T401.
Tyrosine phosphorylated:
Y37, Y59, Y60, Y69, Y236, Y443, Y600.
Ubiquitinated:
K65, K162, K238, K341, K347, K485, K516, K517, K603, K684.
Distribution
Based on gene microarray analysis from the NCBI
Human Tissue Distribution
% Max Expression:
Mean Expression:
Number of Samples:
Standard Deviation:
% Max Expression:
Mean Expression:
Number of Samples:
Standard Deviation:
 81
81
1315
18
984
 6
6
102
5
121
 8
8
129
16
96
 19
19
312
73
741
 72
72
1159
23
648
 15
15
246
18
76
 13
13
205
23
161
 5
5
85
26
121
 0.5
0.5
8
3
1
 11
11
176
71
127
 46
46
741
23
3050
 43
43
692
35
791
 6
6
89
16
137
 0.5
0.5
8
3
1
 9
9
150
23
162
 9
9
148
10
94
 30
30
487
152
819
 7
7
111
19
132
 37
37
591
55
577
 100
100
1615
59
582
 5
5
77
23
87
 6
6
91
23
119
 7
7
106
16
94
 4
4
64
19
132
 8
8
123
23
145
 40
40
653
54
709
 5
5
80
19
85
 6
6
93
19
79
 6
6
90
19
77
 12
12
199
28
100
 91
91
1470
12
42
 16
16
260
16
350
 4
4
68
62
237
 75
75
1205
52
859
 23
23
372
35
158
Evolution
Species Conservation
PhosphoNET % Identity:
PhosphoNET % Similarity:
Homologene %
Identity:
PhosphoNET % Identity:
PhosphoNET % Similarity:
Homologene %
Identity:
 100
100
100
100 98.9
98.9
99.6
99 97.5
97.5
98.8
98 -
-
-
91 -
-
-
- 93.1
93.1
96.7
93 -
-
-
- 89.9
89.9
94.8
90 90.1
90.1
94.3
90 -
-
-
- 75.3
75.3
81.9
- 78.8
78.8
89.5
79 -
-
-
74 64.7
64.7
75.5
69.5 -
-
-
- -
-
-
- -
-
-
- 38.7
38.7
56.4
46 45.5
45.5
60.7
- -
-
-
- -
-
-
- -
-
-
- -
-
-
- -
-
-
- -
-
-
-
For a wider analysis go to PhosphoNET Evolution in PhosphoNET
Binding Proteins
Examples of known interacting proteins
hiddentext
| No. | Name – UniProt ID |
|---|---|
| 1 | RPS6KA1 - Q15418 |
| 2 | RPS6KB1 - P23443 |
| 3 | PRKACA - P17612 |
| 4 | PRKAA2 - P54646 |
| 5 | PRKAA1 - Q13131 |
| 6 | EEF2 - P13639 |
| 7 | MAPK8 - P45983 |
| 8 | MAPKAPK2 - P49137 |
| 9 | MAPK11 - Q15759 |
| 10 | MAPK9 - P45984 |
| 11 | MAPKAPK5 - Q8IW41 |
| 12 | MAPK12 - P53778 |
| 13 | RPS6KB2 - Q9UBS0 |
| 14 | MAPK14 - Q16539 |
| 15 | MAPKAPK3 - Q16644 |
Regulation
Activation:
Activated by phosphorylation at Ser-398. Activated by calcium/calmodulin.
Inhibition:
Inhibited by phosphorylation at Ser-78, Ser-359 and Ser-366.
Synthesis:
NA
Degradation:
NA
Known Upstream Kinases
For further details on these substrates click on the Substrate Short Name or UniProt ID. Phosphosite Location is hyperlinked to PhosphoNET
predictions.
Based on in vitro and/or in vivo phosphorylation data
| Kinase Short Name | UniProt ID (Human) | Phosphosite Location | Phosphosite Sequence | Effect of Phosphorylation |
|---|
| ChaK1 | Q96QT4 | S78 | SSGSPANSFHFKEAW | - |
| AMPKa1 | Q13131 | S78 | SSGSPANSFHFKEAW | - |
| CDK1 | P06493 | S359 | GTEEKCGSPRVRTLS | - |
| p38d | O15264 | S359 | GTEEKCGSPRVRTLS | - |
| RSK1 | Q15418 | S366 | SPRVRTLSGSRPPLL | - |
| RSK2 | P51812 | S366 | SPRVRTLSGSRPPLL | - |
| p70S6K | P23443 | S366 | SPRVRTLSGSRPPLL | - |
| p70S6Kb | Q9UBS0 | S366 | SPRVRTLSGSRPPLL | - |
| PKACa | P17612 | S366 | SPRVRTLSGSRPPLL | - |
| AMPKa1 | Q13131 | S366 | SPRVRTLSGSRPPLL | - |
| MAPKAPK2 | P49137 | S377 | PPLLRPLSENSGDEN | |
| MAPKAPK3 | Q16644 | S377 | PPLLRPLSENSGDEN | |
| eEF2K | O00418 | S396 | TFDSLPSSPSSATPH | |
| p38b | Q15759 | S396 | TFDSLPSSPSSATPH | |
| p38d | O15264 | S396 | TFDSLPSSPSSATPH | |
| AMPKa1 | Q13131 | S398 | DSLPSSPSSATPHSQ | + |
| PKACa | P17612 | S500 | RLHLPRASAVALEVQ |
Known Downstream Substrates
For further details on these substrates click on the Substrate Short Name or UniProt ID. Phosphosite Location is hyperlinked to PhosphoNET
predictions.
Based on in vitro and/or in vivo phosphorylation data
| Substrate Short Name | UniProt ID (Human) | Phosphosite Location | Phosphosite Sequence | Effect of Phosphorylation |
|---|
Inhibitors
For further details on these inhibitors click on the Compound Name and enter it into DrugKiNET or click on the ID's
Based on in vitro and/or in vivo phosphorylation data
| Compound Name | KD, Ki or IC50 (nM) | PubChem ID | ChEMBL ID | PubMed ID |
|---|
| 7-hydroxystaurosporine | IC50 > 100 nM | 72271 | 1236539 | |
| AT9283 | IC50 > 100 nM | 24905142 | 19143567 | |
| Syk Inhibitor IV | IC50 < 600 nM | 10200390 | ||
| A 443654 | IC50 > 900 nM | 10172943 | 379300 | |
| BX517 | IC50 > 900 nM | 11161844 | 228654 | |
| Gö6976 | IC50 > 900 nM | 3501 | 302449 | |
| MK5108 | IC50 > 1 µM | 24748204 | 20053775 | |
| Silmitasertib | IC50 > 1 µM | 24748573 | 21174434 | |
| SNS314 | IC50 > 1 µM | 16047143 | 514582 | 18678489 |
| JNJ-28871063 | IC50 > 4 µM | 17747413 | 17975007 | |
| GSK269962A | IC50 > 4.5 µM | 16095342 | 220241 | |
| Ruboxistaurin | IC50 > 4.5 µM | 153999 | 91829 | |
| TTT-3002 | IC50 > 4.5 µM |
Disease Linkage
General Disease Association:
Neurological disorders
Specific Diseases (Non-cancerous):
Alzheimer's disease (AD)
Comments:
Aberrant translation of tau mRNA is one hypothesis for the abnormal formation of neurofibrillary bundles in AD. In line with this hypothesis, significantly increased levels of phosphorylated EEF2K were observed in brain tissue from AD patients compared to controls, correlated with an overall decrease in eEF2 levels. These changes are predicted to result in elevated tau mRNA levels, potential explaining the observed deposits of tau protein. Together these suggest that abnormalities in translational regulatory components such as EEF2K might contribute to the formation of neurofibrillary bundles and therefore may have a role in the pathogenesis of AD. Alzheimer's disease (AD) is a neurodegenerative disease that causes progressive loss of memory, judgement, and other cognitive processes. The hallmark of AD pathology is the deposition of beta-amyloid plaques and tau tangles. These abnormalities are implicated in the disruption of cellular communication, oxidative cell damage, and eventual cell death. Multiple genes are thought to contribute to AD suceptibility along with epigenetic and environmental factors.
Gene Expression in Cancers:
TranscriptoNET (www.transcriptonet.ca) analysis with mRNA expression data retrieved from the National Center for Biotechnology Information's Gene Expression Omnibus (GEO) database, which was normalized against 60 abundantly and commonly found proteins, indicated altered expression for this protein kinase as shown here as the percent change from normal tissue controls (%CFC) as supported with the Student T-test in the following types of human cancers: Clear cell renal cell carcinomas (cRCC) (%CFC= +57, p<0.008); Colon mucosal cell adenomas (%CFC= -50, p<0.0001); Large B-cell lymphomas (%CFC= +90, p<0.01); and Skin melanomas (%CFC= -83, p<0.012). The COSMIC website notes an up-regulated expression score for eEF2K in diverse human cancers of 531, which is 1.2-fold of the average score of 462 for the human protein kinases. The down-regulated expression score of 44 for this protein kinase in human cancers was 0.7-fold of the average score of 60 for the human protein kinases.
Mutagenesis Experiments:
Insertional mutagenesis studies in mice support a role for this protein kinase in mouse cancer oncogenesis.
Mutation Rate in All Cancers:
Percent mutation rates per 100 amino acids length in human cancers: 0.08 % in 25249 diverse cancer specimens. This rate is very similar (+ 6% higher) to the average rate of 0.075 % calculated for human protein kinases in general.
Mutation Rate in Specific Cancers:
Highest percent mutation rates per 100 amino acids length in human cancers: 0.43 % in 864 skin cancers tested; 0.37 % in 1270 large intestine cancers tested; 0.32 % in 603 endometrium cancers tested; 0.21 % in 589 stomach cancers tested.
Frequency of Mutated Sites:
Most frequent mutations with the number of reports indicated in brackets: T291A (3).
Comments:
Only 1 deletion, and no insertions or complex mutations are noted on the COSMIC website.